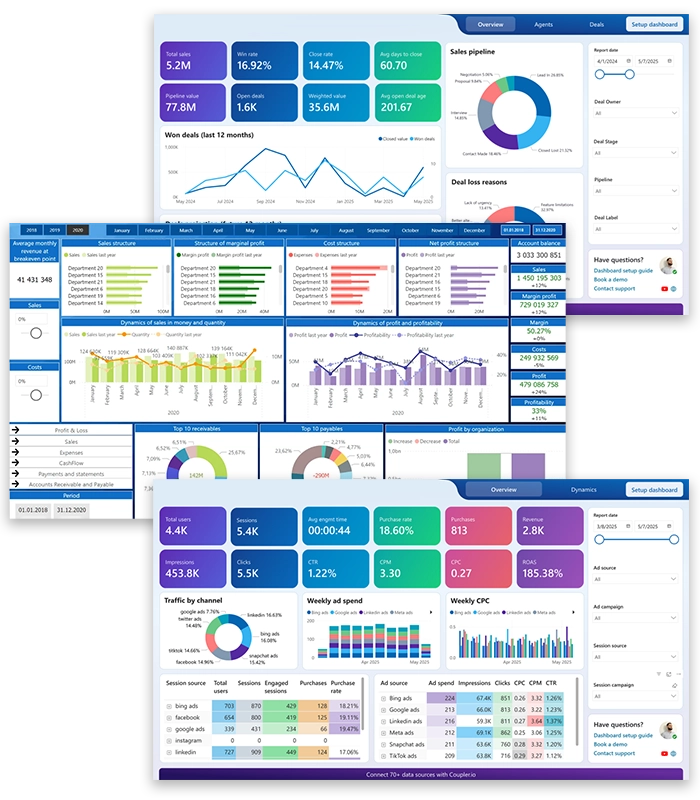
Power BI Dashboard
From raw data to board-ready insight—fast, governed, and scalable
With our core expertise on creating an interactive, real-time Power BI dashboards that turn complex datasets into decisions. Built around the metrics that move your business, our dashboards surface KPIs, competitor movements, and market shifts so leadership teams can:
- Monitor performance through a single source of truth (SSOT)
- Track real-time market & business intelligence
- Decide faster with clarity, drill-downs, and alerts

One page to run the business
Executive Growth Cockpit
- Revenue, margin, pipeline health, forecast bias.
- Market share & price index vs. competitors.
- Strategic initiatives: milestones, impact, risks.

Scan. Sense. Respond.
Market & Competitive Intelligence
- Competitor news & product launches, tender pipeline, policy trackers.
- Pricing monitors, BOM/raw material indices, capacity additions.
- Opportunity heatmaps by region/industry.

Chase the right deals.
Sales & Channel Performance
- Win rates, cycle times, whitespace by account/region.
- Channel partner scorecards, rebate efficiency.
- Dynamic territory planning and quota progress.
Why Syllogist for Power BI?
- Business-first KPIs: built with your leadership questions, not just charts
- Market + internal data: decision context beyond enterprise systems
- Design for adoption: clean layouts, 3-click drill rule, mobile views
- Proven governance: SSOT mindset, certified metrics, security by design

