Market Definition
CHPTAC (3-Chloro-2-hydroxypropyl trimethyl ammonium chloride) is a cationic chemical used primarily as a key intermediate in the production of cationic starch, cationic guar gum, and cationic cellulose. It acts as a quaternizing agent that introduces cationic functional groups into various substrates. The global supply-demand balance of CHPTAC has been influenced in recent years by volatility in raw material prices, energy costs, and tightening environmental regulations.
Market Insights
The CHPTAC market has witnessed fluctuations due to high propylene and epichlorohydrin prices, raw material shortages, and energy cost volatility caused by geopolitical disruptions. These factors impacted production costs in 2021 and 2022, resulting in reduced operating margins for manufacturers. However, with stabilizing energy markets and easing supply bottlenecks in 2023, demand has started to recover, especially from paper, textile, and water treatment industries. The overall outlook remains optimistic as industries increasingly prefer cationic polymers for improving process efficiency and end-product quality.
Rising demand for sustainable papermaking and water recycling processes is one of the major trends shaping the CHPTAC market. Governments across regions such as Europe and Asia-Pacific are tightening discharge norms, thereby increasing the use of cationic flocculants in wastewater treatment. Additionally, the textile industry is shifting toward eco-friendly and high-performance finishes, further driving CHPTAC consumption. The global CHPTAC market is expected to grow at a CAGR of 3.8% from 2023 to 2030, with Asia-Pacific and Europe leading demand recovery.
The competitive landscape is moderately consolidated, with a few large global manufacturers and several regional producers serving localized markets. Supply disruptions during the pandemic and the Russia–Ukraine conflict exposed the vulnerability of producers dependent on imported epichlorohydrin and propylene. However, capacity expansions in China and India are expected to improve supply security. Although margins remain sensitive to raw material costs, CHPTAC demand is projected to rise steadily, driven by industrial water treatment, paper strengthening, and textile modification applications.
Market Dynamics: Drivers
Growing water treatment activities and increasing paper recycling are key demand drivers for CHPTAC. Its use in producing cationic starch and flocculants helps improve retention, drainage, and dewatering efficiency in paper manufacturing. Similarly, in wastewater treatment, CHPTAC-based polymers enhance solid–liquid separation efficiency, making them integral to municipal and industrial applications. The steady expansion of the textile sector in Asia is another contributing factor, where CHPTAC is used to improve dye uptake and fabric softness.
Market Dynamics: Challenges
Volatility in prices of key raw materials such as epichlorohydrin and propylene remains a major challenge affecting CHPTAC profitability. Environmental concerns associated with chlorinated intermediates and high energy consumption during manufacturing are also prompting regulatory scrutiny. Additionally, the emergence of bio-based cationic alternatives in Europe and Japan poses a potential long-term threat, as end users increasingly focus on sustainable chemistries and carbon-neutral supply chains.
Market Segmentation
Based on Application, the Global CHPTAC Market is segmented into
- Cationic Starch Production
- Cationic Guar Gum
- Cationic Cellulose and Cationic Polyacrylamide
- Water & Wastewater Treatment Chemicals
- Textile and Paper Chemicals
- Oilfield Chemicals
- Others
Based on End-Use Industry, the Global CHPTAC Market is segmented into
- Pulp & Paper
- Water Treatment
- Textile
- Oil & Gas
- Personal Care
- Others
Based on Geography, the Global CHPTAC Market is segmented into
- North America
- Europe
- Asia-Pacific
- Latin America
- Middle East & Africa
All market revenue has been given in US Dollar, while the market volumes are given in tons.
Historical Year: 2021–2024
Base Year: 2025
Estimated: 2026
Forecast: 2027–2031
Key Questions this Study will Answer
- What are the key overall market statistics or market estimates (Market Overview, Market Size-By Value, Market Size-By Volume, Forecast Numbers, Market Segmentation, Market Shares) of the Global CHPTAC Market?
- What are the region-wise industry size, growth drivers, challenges, and key market trends?
- What are the key innovations, opportunities, current and future trends, and regulations in the Global CHPTAC Market?
- Who are the key competitors, what are their strengths and weaknesses, and how do they perform in the Global CHPTAC Market based on a competitive benchmarking matrix?
- What are the key results derived from market surveys conducted during the Global CHPTAC Market study?
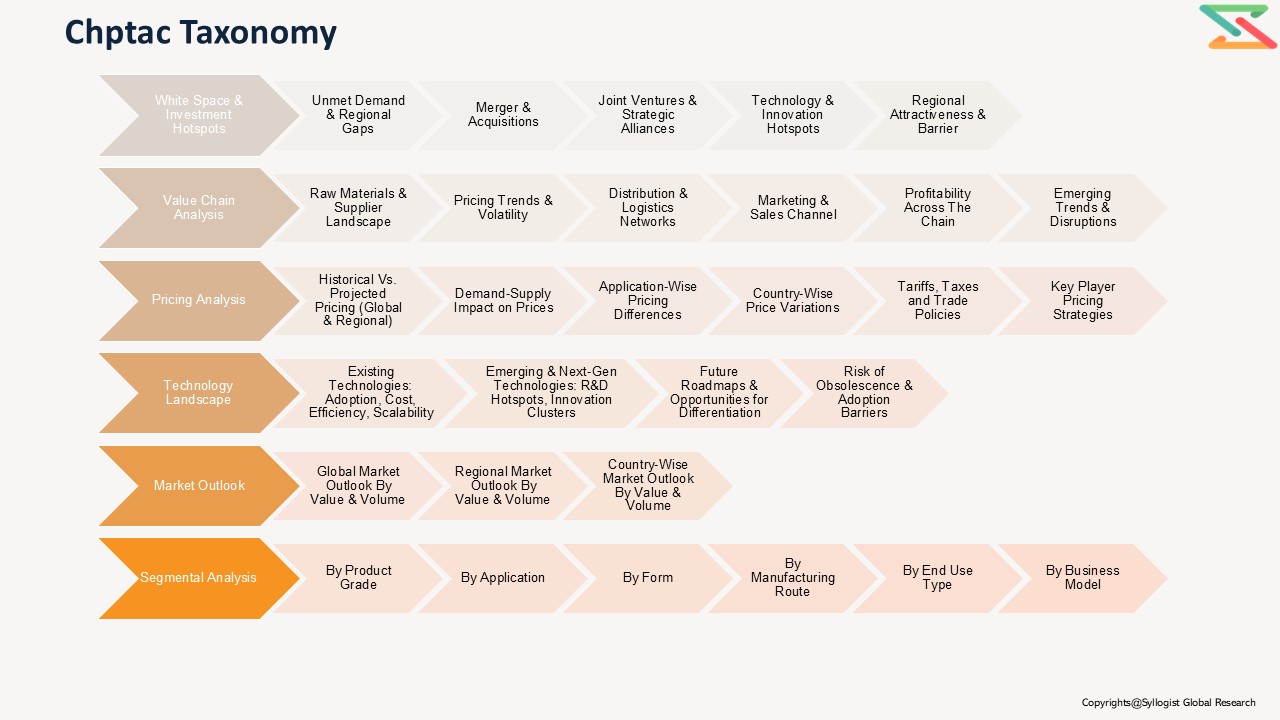
- Market Foundations & Dynamics
- Introduction
1.1. Product Overview (Definition & Scope of CHPTAC — grades, physical form, CAS)
1.1.2. Chemical Life-Cycle Overview (Raw materials → Synthesis → Purification → Formulation → End-use → Disposal)
1.1.3. Research Methodology
1.1.4. Executive Summary
1.1.5. Major Trends Shaping the Market (demand for cationic polymers, sustainability, regulatory scrutiny)
1.1.6. Short-Term vs. Long-Term Opportunities (textiles & paper recovery vs. specialty applications)
1.1.7. Comparison of CHPTAC vs. Alternative Cationic Agents (glycidyl trimethylammonium salts, other quaternary ammonium reagents)
1.1.8. Scenario Planning (Base, Optimistic, Conservative)
1.1.9. Sensitivity Analysis (feedstock prices, regulatory restrictions, capacity additions)
1.1.10. Identification of Regional Investment Hotspots (Asia-Pacific, North America, Europe) - Market Dynamics
- Introduction
- Drivers (demand for cationic starch, wet-end paper additives, textile finishing, wastewater flocculants)
- Restraints (epichlorohydrin/halogenated intermediate concerns, regulations, impurity handling)
- Opportunities (high-value specialty grades, green synthesis routes, downstream integration)
- Challenges (raw material shortages, environmental & safety constraints)
- Porter’s Five Forces Analysis
- PESTLE Analysis
- Market Ecosystem & Value Chain
3.1. Overview of Value Chain Participants
1.3.1.1. Raw Material Suppliers (epichlorohydrin/glycidyl sources, trimethylamine suppliers, solvents, catalysts)
1.3.1.2. CHPTAC Manufacturers (bulk & specialty producers)
1.3.1.3. Intermediate & Formulation Companies (cationic starch producers, cationic cellulose, polymer manufacturers)
1.3.1.4. End-Use Formulators (paper, textile, wastewater, adhesives, oilfield chemicals)
1.3.1.5. Distributors & Traders
1.3.1.6. End Users (paper mills, textile mills, municipal & industrial wastewater plants, adhesive makers)
1.3.2. Flow of Value and Material Through the Chain
1.3.3. Value Addition and Margins at Each Stage
1.3.3.1. Raw Material Procurement
1.3.3.2. Synthesis / Quaternization / Reaction Control
1.3.3.3. Purification & Quality Assurance (residual epichlorohydrin, chloride content)
1.3.3.4. Formulation & Packaging
1.3.3.5. Distribution / Sales
1.3.4. Integration Trends (captive raw material feedstock vs. merchant suppliers)
1.3.5. Impact of Vertical Integration (downstream tie-ups with starch/cellulose producers) - Mapping of Roles and Interdependencies
- Market Trends & Developments
5.1. White Market Space Analysis (new applications — biopolymers, personal care, specialty oilfield chemistries)
1.5.2. Demand–Supply Gaps (high-purity grades, regulatory-compliant supplies)
1.5.3. Investment Hotspots (manufacturing capacity expansions, downstream conversion hubs)
1.5.4. Unmet Needs (low-impurity CHPTAC for pharma/food contact, greener synthesis) - Risk Assessment Framework
6.1. Political / Geopolitical Risk (trade barriers, export controls on intermediates)
1.6.2. Operational Risk (process safety, toxic intermediates handling)
1.6.3. Environmental Risk (VOC, halogenated by-products, effluent)
1.6.4. Financial Risk (feedstock price volatility, currency exposure)
- Market Ecosystem & Value Chain
- Regulatory Framework & Standards
- Global Regulatory Overview
1.1. EU REACH & Candidate List Implications (registration, restriction potential)
2.1.2. U.S. TSCA / EPA Considerations (reporting, emissions)
2.1.3. China Chemical Registration & Control Policies
2.1.4. India Chemical/Environmental Compliance Requirements
2.2. Compliance & Certification Requirements (residual ECH limits, chloride content, impurity specs)
2.3. Transportation and Storage Regulations (hazard classification, UN packing, cold chain if any)
2.4. Safety & Quality Standards (occupational exposure limits, MSDS, GMP where relevant)
2.5. Environmental & Liability Considerations (waste management, remediation responsibilities)
2.6. Traceability & Documentation (COA, batch traceability, SDS compliance)
- Global Regulatory Overview
- Technology Landscape
- Synthesis Routes & Process Chemistry
1.1. Traditional Epichlorohydrin → Quaternization Route
3.1.2. Alternative / Green Routes (bio-derived glycidyl sources, ECH substitutes)
3.2. Process Equipment & Reactor Technologies (batch vs. continuous, reactor materials)
3.3. Purification, Neutralization & Impurity Control (removal of excess ECH, chlorinated by-products)
3.4. Analytical & QC Methods (GC, HPLC, ICP for metal residues, titration for active chlorine)
3.5. Formulation Technologies (aqueous solutions, stabilized concentrates, solids)
3.6. Safety & Containment Technologies (VOC capture, scrubbers, closed-loop systems)
3.7. Innovations to Reduce Cost & Environmental Footprint (process intensification, waste valorization)
- Synthesis Routes & Process Chemistry
- Global, Regional & Country Forecasts (2020–2035)
- Global CHPTAC Market Outlook (value, volume)
- Market Share by:
2.1. By Application/End-Use (Paper & Paperboard — dry & wet strength, retention aids; Textiles — cationic sizing & dyes; Wastewater Treatment — flocculants & coagulants; Adhesives & Coatings; Oilfield Chemicals; Personal Care & Specialty)
4.2.2. By Product Grade (Technical Grade, High-Purity Grade, Formulated Concentrates)
4.2.3. By Form (Aqueous Solution, Liquid Concentrate, Solid/Granular)
4.2.4. By Manufacturing Route (Conventional ECH route, alternative routes)
4.2.5. By End-User Type (Large pulp & paper companies, textile mills, municipal wastewater utilities, industrial end users)
4.2.6. By Business Model (Merchant CHPTAC, Toll Manufacturing, Captive Consumption)
4.2.7. By Company - Regional & Country Outlook (2020–2035)
3.1. Asia-Pacific (China, India, South Korea, Japan, Vietnam)
4.3.2. North America (U.S., Canada, Mexico)
4.3.3. Europe (Germany, Italy, UK, Scandinavia)
4.3.4. Latin America (Brazil, Argentina)
4.3.5. Middle East & Africa (UAE, South Africa)
- Pricing Analysis
- Overview of Pricing Structures (per kg / per ton; price by form and grade)
2. Average Selling Price (ASP) Trends by Grade and Region
5.3. Cost Benchmark:
5.3.1. CHPTAC vs. Other Cationic Agents (cost per functional charge unit)
5.3.2. Toll vs. Merchant Supply Cost Comparison
5.4. Price Sensitivity by Application (commodity paper vs. specialty textile finishing)
5.5. Historical Price Evolution (2015–2025)
5.6. Forecast Pricing Curve (2025–2035)
5.7. Factors Influencing Price:
5.7.1. Epichlorohydrin & Trimethylamine Feedstock Prices
5.7.2. Energy, Utilities & Waste Treatment Costs
5.7.3. Regulatory Compliance & Certification Costs
5.8. Regional Pricing Differentiation (Asia vs. Europe vs. North America)
5.9. Impact of Raw Material & Regulatory Shifts on CHPTAC Pricing
- Overview of Pricing Structures (per kg / per ton; price by form and grade)
- Competition Outlook
- Market Concentration and Fragmentation Level
2. Company Market Shares (Top 10 Producers — global & regional)
6.3. Competitive Strategies (capacity expansion, downstream tie-ups, specialty grades, green credentials)
6.4. Benchmarking Matrix (Scale vs. Grade Portfolio vs. Regulatory Compliance)
6.5. Recent Developments (M&A, joint ventures, capacity projects, product launches)
- Market Concentration and Fragmentation Level
- Cost Structure & Margin Analysis
- Detailed Cost Breakdown (raw materials, utilities, labor, effluent treatment, compliance)
2. Average Cost per Stage (synthesis, purification, formulation, packaging)
7.3. Profitability and Margin Distribution Along Value Chain
7.3.1. Raw Material Supplier Margin
7.3.2. CHPTAC Manufacturer Margin
7.3.3. Formulator / Converter Margin (e.g., cationic starch manufacturers)
7.3.4. Distributor Margin
7.4. Sensitivity Analysis: How Feedstock Prices & Regulatory Compliance Costs Impact Margin
7.5. Cost Reduction Opportunities (process optimization, co-location with feedstock producers, waste valorization)
- Detailed Cost Breakdown (raw materials, utilities, labor, effluent treatment, compliance)
- Business Models & Strategic Insights
- Merchant CHPTAC Supply Model (bulk commodity)
2. Captive / Integrated Manufacturer Model (producer + downstream user)
8.3. Toll Manufacturing & Contract Production Models
8.4. Specialty / High-Purity Producer Model (for personal care, pharma contact)
8.5. Value-Added Formulation & Licensing Models
8.6. Economic Viability Comparison of Models
8.7. SWOT Analysis of Leading Models
- Merchant CHPTAC Supply Model (bulk commodity)
- Investment & Financial Analysis
- CAPEX and OPEX Benchmarks for CHPTAC Plants (small, medium, large scale)
2. Payback Period and IRR Sensitivity (by region & product mix)
9.3. Financial Modeling Assumptions (capacity utilization, yield, regulatory capex)
9.4. Revenue Streams:
9.4.1. Bulk CHPTAC Sales
9.4.2. Premium High-Purity Sales
9.4.3. Formulated Products & Downstream Sales
9.4.4. Toll Manufacturing Income
9.5. Investment Case Studies (greenfield plant, expansion, backward integration with ECH or glycidyl feedstocks)
9.6. Funding Landscape: Strategic Investors, Private Equity, Industrial Partners
- CAPEX and OPEX Benchmarks for CHPTAC Plants (small, medium, large scale)
- Sales & Distribution Channel Analysis
- Overview of Go-to-Market Channels
1.1. Direct Sales (manufacturer → large industrial user)
10.1.2. Indirect Sales via Distributors & Chemical Traders
10.1.3. Toll & Contract Manufacturing Arrangements
10.2. Channel Share by Region
10.3. Typical Channel Flow Diagram (manufacturer → formulator → end user)
10.4. Sales Process (specification, sampling, QA/QC, logistics)
10.5. Distribution Strategies by Leading Players (local stocking, bulk exports, blended offerings)
10.6. Emerging Trends:
10.6.1. On-demand Toll Manufacturing Platforms
10.6.2. Digital Marketplaces for Specialty Intermediates
10.6.3. Co-development Partnerships with Downstream Users
- Overview of Go-to-Market Channels
- Strategic Recommendations & Roadmap
- Competitors’ Strategic Initiatives (product differentiation, sustainability claims)
2. Future Outlook (next 5–10 years — regulatory tightening, specialty grade growth)
11.3. Strategic Recommendations
11.3.1. Technology & Process Advancements to Watch (green ECH alternatives, continuous production)
11.3.2. Circularity & Feedstock Security Roadmap (2030–2035)
11.3.3. Strategic Recommendations for Stakeholders (manufacturers, formulators, investors)
11.4. CHPTAC Market Acceleration Roadmap
11.4.1. Short-term (2025–2027): Compliance readiness, pilot green routes, quality standardization
11.4.2. Mid-term (2028–2030): Scale-up of specialty grades, downstream integration, geographic hubs
11.4.3. Long-term (2031–2035): Low-emission production, alternative chemistries, circular feedstock models
11.5. Tailored recommendations for:
11.5.1. CHPTAC Manufacturers
11.5.2. Downstream Converters (starch, cellulose, polymer formulators)
11.5.3. End Users (paper mills, textile processors, wastewater operators)
11.6. Recommendations on Key Success Factors
11.6.1. Partnerships & Alliances (feedstock suppliers, downstream integrators)
11.6.2. Digitalization & Quality Traceability (batch COAs, digital QC dashboards)
11.6.3. Regulatory Alignment & Certification Compliance
11.6.4. Investor Confidence & Capital Availability
- Competitors’ Strategic Initiatives (product differentiation, sustainability claims)