Market Definition
Gas-to-Liquid (GTL) technology continues to be defined as a chemical conversion process that transforms natural gas into high-quality liquid fuels such as diesel, naphtha, base oils, and specialty lubricants. The process relies on converting methane into syngas through reforming or partial oxidation, followed by Fischer–Tropsch synthesis to generate long-chain hydrocarbons. GTL-derived fuels remain attractive due to their ultra-low sulfur content, high cetane numbers, and cleaner combustion characteristics, positioning them as premium substitutes for conventional petroleum fuels.
Market Insights
During the last assessment cycle, the Global Gas-to-Liquid Market experienced renewed momentum as part of broader energy transition efforts and increasing commercial availability of natural gas. Countries with substantial gas resources, such as Qatar, South Africa, Nigeria, and Malaysia, continued leveraging GTL to diversify their fuel portfolios and enhance downstream value capture. At the same time, the inherent capital intensity of world-scale GTL plants and sensitivity to natural gas–crude oil price differentials remained key constraints, limiting new mega-project announcements.
A major development last year was the accelerating shift toward micro-GTL and modular GTL technologies. These smaller, scalable units helped lower project risk and opened new pathways for monetizing stranded gas, flare gas, and remote field resources, segments historically uneconomical for traditional GTL facilities.
The global push toward cleaner fuels and decarbonization also strengthened GTL’s relevance. GTL diesel, with its near-zero sulfur and low aromatic content, aligned well with tightening global fuel standards like Euro VI and IMO 2020. In aviation, growing interest in synthetic fuels supported by ICAO’s CORSIA framework led to several pilot-scale deployments of GTL-based synthetic jet fuels as early transition options within the broader Sustainable Aviation Fuel (SAF) ecosystem.
Another emerging trend last year was the increased research into integrating GTL with CCUS (carbon capture, utilization, and storage) technologies. This combination provided a pathway to lower-carbon synthetic fuels, especially when paired with next-generation catalysts and digital optimization tools. Companies such as Shell, Sasol, Chevron, and Velocys continued to invest in process improvements to reduce operating costs and improve energy efficiency.
Market Dynamics: Drivers
- Growing natural gas availability and monetization needs, especially from unconventional sources.
- Rising global demand for ultra-clean fuels driven by tough emission norms.
- Strategic energy diversification for gas-rich countries looking to reduce crude dependency.
- Advances in modular GTL systems, lowering capex thresholds and expanding deployment feasibility.
Market Dynamics: Challenges
- High project capex/opex, making large-scale plants viable only in select geographies.
- Volatility in crude-gas price spread, influencing GTL competitiveness.
- CO₂ emissions during GTL synthesis, requiring CCUS integration to achieve low-carbon fuel status.
- Technical hurdles such as catalyst degradation and reactor fouling that require continuous R&D.
Market Outlook
The market was projected to maintain steady growth through 2029, driven by favorable gas feedstock economics, expanding modular GTL deployments, and hybrid pathways integrating renewable hydrogen. The Middle East and Africa were expected to remain global supply leaders, supported by robust gas reserves and policies focused on reducing gas flaring. North America and parts of Europe exhibited rising interest in small-scale GTL for flare-gas remediation and niche low-carbon synthetic fuel applications.
Competitive Landscape
The competitive environment remained moderately consolidated. Major energy companies, Shell, Sasol, Chevron, ExxonMobil, and Velocys, continued to dominate core GTL technologies and operational know-how. While Shell’s Pearl GTL facility in Qatar remained the global benchmark for large-scale operations, smaller modular projects gained traction across North America, APAC, and emerging markets. Growing participation from engineering licensors and CCUS technology providers suggested an industry shift toward integrated, lower-carbon GTL solutions.
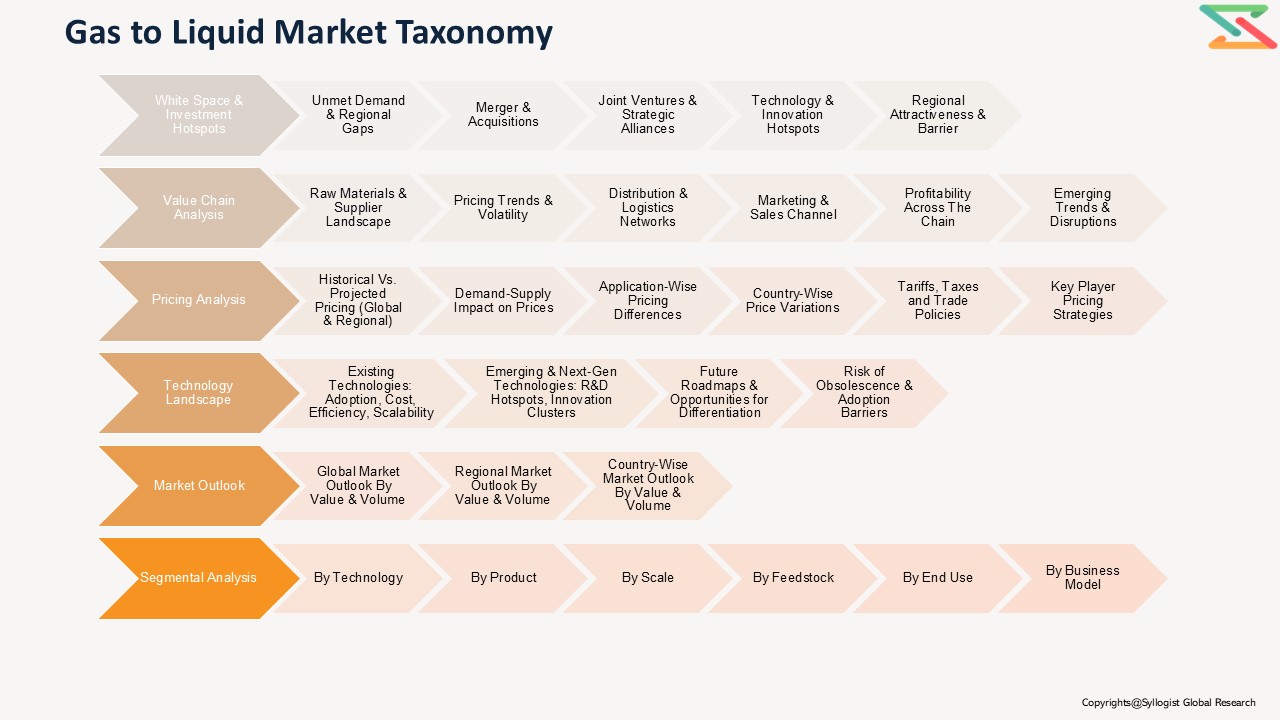
Market Segmentation
- By Product Type:
- Diesel
- Naphtha
- Lubricants
- Waxes
- Others
- By Technology:
- Fischer–Tropsch Synthesis
- Methanol-to-Liquid (MTL)
- Syngas-to-Liquid (STL)
- By Application:
- Transportation
- Industrial
- Power Generation
- Marine
- Others
- By Plant Type:
- Large-scale GTL Plants
- Mini-GTL/Modular Units
- By Geography:
- North America
- Europe
- Asia-Pacific
- Latin America
- Middle East & Africa
All market revenues are expressed in USD Million.
Historical Year: 2019–2022 | Base Year: 2023 | Estimated Year: 2024 | Forecast Period: 2025–2029
Key Questions this Study Will Answer
- What is the global and regional market size of the Gas-to-Liquid industry by value?
- Which GTL technologies are most commercially viable and scalable?
- What are the emerging investment hotspots for modular GTL projects?
- How are carbon-neutral and CCUS-integrated GTL technologies shaping the future market outlook?
- Who are the leading players, and how do they benchmark in terms of technological capability, production scale, and financial performance?
- Market Foundations & Dynamics
- Introduction
1.1. Product Overview (Definition & Scope of GTL — Fischer-Tropsch GTL, methanol-to-gasoline/diesel/olefins, indirect GTL routes, product slate: GTL diesel, naphtha, jet, base oils, waxes)
1.1.2. GTL Value-Chain Overview (Natural gas → Syngas → Synthesis (FT / MTO / MTG) → Upgrading & Hydroprocessing → Product Distribution → End-use)
1.1.3. Research Methodology
1.1.4. Executive Summary
1.1.5. Major Trends Shaping the Market (feedstock availability, LNG price dynamics, decarbonization pressure, downstream petrochem demand)
1.1.6. Short-Term vs. Long-Term Opportunities (mast projects, modular small-scale GTL, integration with LNG / hydrogen / CCUS)
1.1.7. Comparison of GTL Pathways vs. Conventional Refining & Alternative Routes (biofuels, green hydrogen + e-fuels)
1.1.8. Scenario Planning (Base, Optimistic, Conservative — oil/gas prices, carbon costs, policy support)
1.1.9. Sensitivity Analysis (natural gas price, carbon price, CAPEX, catalyst life)
1.1.10. Identification of Regional Investment Hotspots (gas resource basins, export hubs, low-carbon incentive regions) - Market Dynamics
- Introduction
- Drivers (abundant stranded gas monetization, demand for low-sulfur marine & aviation fuels, high-quality base oils)
- Restraints (high CAPEX, complex scale-up, feedstock logistics)
- Opportunities (small-scale modular GTL, integration with CCUS/blue hydrogen, chemicals production)
- Challenges (carbon intensity, project financing, catalyst & technology licensing)
- Porter’s Five Forces Analysis
- PESTLE Analysis
- Market Ecosystem & Value Chain
3.1. Overview of Value Chain Participants
1.3.1.1. Gas Producers & Suppliers (upstream operators, stranded gas monetization projects)
1.3.1.2. Technology & Catalyst Providers (FT licensors, MTO/MTG licensors)
1.3.1.3. EPC Contractors & Modular Plant Providers
1.3.1.4. Syngas Producers (steam methane reforming, autothermal reforming, partial oxidation)
1.3.1.5. Hydroprocessing & Refining / Upgrading Facilities
1.3.1.6. Distributors, Traders & Offtakers (fuel suppliers, petrochemical buyers)
1.3.2. Flow of Value and Material Through the Chain
1.3.3. Value Addition and Margins at Each Stage
1.3.3.1. Gas Feedstock Procurement & Conditioning
1.3.3.2. Syngas Production & Conditioning
1.3.3.3. Synthesis (FT / MTO / MTG) & Catalyst Costs
1.3.3.4. Upgrading, Hydrocracking & Blending
1.3.3.5. Distribution & Sales (marine fuel, jet, diesel, petrochemical feedstocks)
1.3.4. Integration Trends (integrated gas + GTL + export terminal vs. merchant GTL)
1.3.5. Impact of Vertical Integration (gas producer owning GTL plant, offtake security) - Mapping of Roles and Interdependencies
- Market Trends & Developments
5.1. White Market Space Analysis (modular small-scale GTL, niche specialty products, GTL lubricants)
1.5.2. Demand–Supply Gaps (clean marine & aviation fuel supply, chemical feedstock shortages)
1.5.3. Investment Hotspots (Middle East, North America shale hubs, Africa gas basins, Australia)
1.5.4. Unmet Needs (cost-effective small-scale solutions, low-carbon product certification) - Risk Assessment Framework
6.1. Political / Geopolitical Risk (export controls, resource nationalization, sanctions)
1.6.2. Operational Risk (project execution delays, catalyst deactivation, feedstock variability)
1.6.3. Environmental Risk (GHG footprint, flaring reduction, water usage)
1.6.4. Financial Risk (CAPEX overruns, commodity price swings, offtake contract risk)
- Market Ecosystem & Value Chain
- Regulatory Framework & Standards
- Global Regulatory Overview
1.1. Fuel Quality & Emissions Standards (IMO 2019/2024, aviation fuel specs, regional diesel/naphtha specs)
2.1.2. Environmental Regulations (carbon pricing, MRV – measurement, reporting & verification)
2.1.3. Local Content & Licensing (host country requirements for project development)
2.2. Compliance & Certification Requirements (fuel certification for aviation/marine, fuel blending regs)
2.3. Transportation and Storage Regulations (LNG/GTL terminals, shipping regs, tank storage)
2.4. Safety, Health & Environmental Standards (process safety management, HSE standards)
2.5. Environmental & Liability Considerations (CCUS permitting, emissions liability)
2.6. Incentives & Policy Mechanisms (tax credits, production subsidies, low-carbon fuel standards)
- Global Regulatory Overview
- Technology Landscape
- Syngas Production Technologies (SMR, ATR, POX, electrified reforming)
2. Synthesis Technologies
3.2.1. Fischer-Tropsch (fixed/microchannel/trickle bed reactors, slurry FT)
3.2.2. Methanol-to-Olefins / Methanol-to-Gasoline (MTO/MTG) pathways
3.3. Catalyst Technologies & Life (FT catalysts, methanol catalysts, regeneration strategies)
3.4. Upgrading & Hydroprocessing Technologies (hydrocracking, hydroisomerization, wax upgrading)
3.5. Modular & Small-Scale GTL Solutions (micro-FT, distributed GTL)
3.6. Integration with CCUS, Blue Hydrogen & Renewable Hydrogen (hybrid pathways)
3.7. Process Digitalization & Plant Optimization (digital twins, advanced process control)
3.8. Innovations to Reduce CAPEX/OPEX (intensified reactors, electrification, alternative syngas routes)
- Syngas Production Technologies (SMR, ATR, POX, electrified reforming)
- Global, Regional & Country Forecasts (2019–2029)
- Global GTL Market Outlook (value, volume; product split by diesel, naphtha, jet, base oils, chemicals)
- Market Share by:
2.1. By Technology Pathway (Fischer-Tropsch GTL, Methanol-to-Liquids, Hybrid routes)
4.2.2. By Product (GTL diesel, GTL naphtha, jet fuel, base oils, waxes, petrochemical feedstocks)
4.2.3. By Scale (mega-projects, brownfield integration, small-scale modular)
4.2.4. By Feedstock Source (associated gas, non-associated gas, stranded gas, pipeline gas, LNG)
4.2.5. By End-Use (transport fuels, aviation, marine, lubricant base stocks, petrochemicals)
4.2.6. By Business Model (producer-integrated, merchant GTL, tolling/contract manufacturing)
4.2.7. By Company / Project - Regional & Country Outlook (2019–2029)
3.1. Middle East (Qatar, UAE, Saudi Arabia)
4.3.2. North America (U.S., Canada)
4.3.3. Africa (Nigeria, Mozambique, Angola)
4.3.4. Asia-Pacific (Australia, China, Malaysia)
4.3.5. Latin America (Trinidad & Tobago, Argentina)
- Pricing Analysis
- Overview of Pricing Structures (per barrel equivalent, $/bbl FOB, $/ton for chemicals, $/kg for specialty products)
2. ASP Trends by Product and Region (GTL diesel premium vs. conventional diesel, aviation fuel pricing)
5.3. Cost Benchmark: GTL vs. Conventional Refining & Alternative Fuels (CAPEX/OPEX per bbl production)
5.4. Price Sensitivity by Application (marine/aviation low-sulfur demand, specialty base oil premiums)
5.5. Historical Price Evolution (2019–2024)
5.6. Forecast Pricing Curve (2025–2029)
5.7. Factors Influencing Price:
5.7.1. Natural Gas Feedstock Price & Transport Costs
5.7.2. Capital Intensity & Financing Costs
5.7.3. Catalyst & Operating Costs (hydrogen, utilities)
5.7.4. Carbon Pricing & Emission Compliance Costs
5.8. Regional Pricing Differentiation (landed costs, taxation, subsidies)
5.9. Impact of Low-Carbon Premiums & Fuel Standards on GTL Pricing
- Overview of Pricing Structures (per barrel equivalent, $/bbl FOB, $/ton for chemicals, $/kg for specialty products)
- Competition Outlook
- Market Concentration and Fragmentation Level
2. Company & Project Portfolios (major GTL licensors, EPCs, national oil companies with GTL assets)
6.3. Competitive Strategies (integration with LNG/Refining, offtake contracts, modularisation, green branding)
6.4. Benchmarking Matrix (Technology vs. Scale vs. Feedstock Access vs. Carbon Intensity)
6.5. Recent Developments (project announcements, joint ventures, capacity expansions, technology licensing)
- Market Concentration and Fragmentation Level
- Cost Structure & Margin Analysis
- Detailed Cost Breakdown (gas feedstock, syngas production, synthesis, upgrading, utilities, catalyst replacement)
2. Average Cost per Stage (CAPEX amortization, OPEX drivers per barrel equivalent)
7.3. Profitability and Margin Distribution Along Value Chain
7.3.1. Gas Supplier Margin / Opportunity Cost of Gas
7.3.2. GTL Producer Margin (product mix dependent)
7.3.3. Upgrader / Refinery Margin (integration benefits)
7.3.4. Distributor / Trader Margin
7.4. Sensitivity Analysis: How Gas Price, CAPEX & Carbon Price Impact Margin
7.5. Cost Reduction Opportunities (heat integration, modular construction, catalyst life extension)
- Detailed Cost Breakdown (gas feedstock, syngas production, synthesis, upgrading, utilities, catalyst replacement)
- Business Models & Strategic Insights
- Integrated Producer Models (NOC / IOC owning gas upstream + GTL plant + export terminals)
2. Merchant GTL & Tolling Models (third-party gas monetization)
8.3. Modular & Distributed GTL Service Models (small-scale units, remote monetization)
8.4. Low-Carbon GTL & Blue GTL Models (CCUS integration, blue hydrogen pathways)
8.5. Economic Viability Comparison of Models (CAPEX intensity vs. revenue certainty)
8.6. SWOT Analysis of Leading Models
- Integrated Producer Models (NOC / IOC owning gas upstream + GTL plant + export terminals)
- Investment & Financial Analysis
- CAPEX and OPEX Benchmarks for GTL Projects (FT plants, MTO/MTG, upgrading units)
2. Payback Period and IRR Sensitivity (by feedstock price, product slate, offtake contracts)
9.3. Financial Modeling Assumptions (plant utilization, catalyst life, transport & logistics costs)
9.4. Revenue Streams: Fuel sales, petrochemical co-products, lubricant base oil premiums, carbon credits/low-carbon premiums
9.5. Investment Case Studies (Qatar Shell GTL, small-scale projects, integrated hub examples)
9.6. Funding Landscape: Project finance, export credit agencies, strategic investors, green financing for low-carbon GTL
- CAPEX and OPEX Benchmarks for GTL Projects (FT plants, MTO/MTG, upgrading units)
- Sales & Distribution Channel Analysis
- Overview of Go-to-Market Channels (direct to refiners/traders, long-term contracts, spot markets, bunker suppliers)
2. Channel Share by Region & Product Type
10.3. Typical Channel Flow Diagram (producer → terminal → shipping / pipeline → offtaker)
10.4. Sales Process (specification, certification for aviation/marine, logistics planning)
10.5. Distribution Strategies by Leading Players (captive terminals, blending partnerships, trading desks)
10.6. Emerging Trends:
10.6.1. Blending & Co-marketing with conventional fuels (drop-in capability)
10.6.2. Low-carbon fuel certification & premium marketing
10.6.3. Integration with LNG / Hydrogen export value chains
- Overview of Go-to-Market Channels (direct to refiners/traders, long-term contracts, spot markets, bunker suppliers)
- Strategic Recommendations & Roadmap
11.2. Future Outlook (next 5–10 years — role in low-sulfur fuel supply, niche specialty products, decarbonized GTL)
11.3. Strategic Recommendations
11.3.1. Technology & Operational Priorities to Watch (small-scale FT, electrified syngas, CCUS cost reductions)
11.3.2. GTL Commercialization Roadmap (2024–2029)
11.3.3. Strategic Recommendations for Stakeholders (NOCs, IOCs, EPCs, technology licensors, investors)
11.4. GTL Market Acceleration Roadmap
11.4.1. Short-term (2023–2025): de-risk pilot modular units, secure long-term offtakes, evaluate CCUS integration
11.4.2. Mid-term (2026–2027): scale modular fleets, strengthen export logistics, pursue low-carbon certification
11.4.3. Long-term (2028–2029): integrate with hydrogen & CCUS value chains, target specialty high-margin products
11.5. Tailored recommendations for:
11.5.1. Gas Producers & NOCs
11.5.2. Technology Licensors & EPCs
11.5.3. Offtakers & Traders (marine/aviation fuel suppliers, petrochemical buyers)
11.6. Recommendations on Key Success Factors
11.6.1. Partnerships & Alliances (offtake, finance, CCUS providers)
11.6.2. Digitalization & Plant Optimization (digital twins, predictive maintenance)
11.6.3. Policy Alignment & Low-Carbon Certification (GHG accounting, incentives)
11.6.4. Investor Confidence & Capital Availability- Market Foundations & Dynamics