Market Definition
Chemical recycling of plastics refers to a family of advanced technologies that break down post-use plastic waste at the molecular or polymer level into their constituent monomers, oligomers, or hydrocarbon feedstocks, enabling the production of new virgin-equivalent plastics, fuels, or chemical intermediates. Unlike mechanical recycling, which physically reprocesses plastics while largely preserving the polymer chain and is therefore limited to relatively clean, single-stream waste, chemical recycling is capable of processing contaminated, mixed, and multi-layered plastic streams that are otherwise unrecyclable. The market is broadly defined by three principal technology families: pyrolysis (thermochemical decomposition of polymers in the absence of oxygen to produce pyrolysis oil or gas), gasification (high-temperature partial oxidation producing syngas), and solvolysis (dissolution of polymers using solvents, heat, or catalysts, including glycolysis, methanolysis, hydrolysis, and aminolysis). These core processes are complemented by emerging approaches including enzymatic depolymerisation, supercritical fluid processing, and plasma-assisted pyrolysis. The output spectrum spans recycled feedstocks for petrochemical crackers, circular monomers for polyester and polyamide resins, fuel-grade hydrocarbons for the road transport and marine sectors, and certified circular plastics used in food-contact packaging and high-specification consumer goods under mass-balance accounting frameworks.
Market Insights
The most consequential strategic development reshaping the global chemical recycling landscape in 2026 is the transition from pilot-scale demonstration to industrial-scale commercial deployment, a shift that is simultaneously validating the technology’s promise and exposing the formidable gap between laboratory yield metrics and real-world economics. Companies including Plastic Energy, Neste, Dow, INEOS, Eastman, PureCycle Technologies, Carbios, and Brightmark have commissioned or are actively scaling facilities ranging from 20,000 to 100,000 tonnes per annum of plastic waste input. Each of these projects is providing the industry with hard data on three critical questions that have thus far been answered primarily by modelling: actual feedstock pre-treatment costs at scale, real contaminant tolerance thresholds under continuous operation, and the true yield of on-specification output versus the off-spec fractions that must be managed as residue. The emerging picture is one of significant process-specific variance, catalytic pyrolysis is proving more economical for mixed polyolefin streams but more sensitive to chlorine and sulphur contamination than initially modelled, while enzymatic PET depolymerisation is achieving near-theoretical monomer yields under controlled conditions but faces cost challenges in enzyme production and product isolation at scale. These data points are driving a rapid consolidation of investor confidence around the most technically differentiated and economically defensible technology positions.
Geographically, Europe remains the most advanced regulatory and investment environment for chemical recycling, driven by the European Green Deal, the Circular Economy Action Plan, and the Packaging and Packaging Waste Regulation (PPWR) which mandates minimum recycled content thresholds that mechanical recycling alone cannot satisfy for food-contact applications. The EU’s formal recognition of chemical recycling outputs as recyclate under mass-balance accounting, subject to verification standards still being finalised under CEN and ISO frameworks, has been a critical enabler, as it provides the legal basis for brand owners to count chemically recycled content toward their recycled content commitments. North America is the second most active investment market, propelled by the Inflation Reduction Act’s advanced manufacturing tax credits, state-level extended producer responsibility (EPR) legislation, and the strategic imperative of domestic petrochemical companies to transition their asset bases toward circular feedstock models. Asia Pacific, and specifically Japan, South Korea, and China, represents the largest untapped volume opportunity, given the region’s dominance in both plastic production and waste generation, though regulatory clarity and infrastructure investment for post-consumer waste sorting remain the primary barriers to near-term scale-up.
The primary structural growth catalyst for chemical recycling is the accelerating convergence of regulatory pressure and brand owner procurement commitments that is creating a credible, non-discretionary demand signal for chemically recycled content at volumes that mechanical recycling cannot supply. The European PPWR mandates that flexible plastic packaging achieve 10% chemically recycled content by 2030, rising to 15% by 2035, targets that are effectively unachievable without large-scale pyrolysis and solvolysis capacity, given the contamination levels and material complexity of post-consumer flexible films. Simultaneously, major consumer goods companies including Unilever, Nestlé, P&G, and LVMH have made public commitments to incorporate chemically recycled content across their packaging portfolios by 2025–2030, creating long-term offtake agreements that are directly enabling project financing for chemical recycling assets. This demand-pull dynamic is fundamentally different from the supply-push economics that has characterised most recycling infrastructure investment historically, and it represents the single most important structural change in the market’s risk profile. However, these growth catalysts are counterbalanced by persistent technical challenges, feedstock heterogeneity, process scale-up risks, energy intensity, and the economics of competing against virgin polymer prices that remain structurally supported by low-cost shale gas feedstocks in North America and integrated petrochemical hubs in the Middle East and Asia.
Key Drivers
- The foundational demand driver in 2026 is the binding regulatory architecture being constructed across the European Union, United Kingdom, and multiple North American jurisdictions that is creating a mandatory, price-inelastic market for chemically recycled content in packaging, textiles, and automotive applications. The EU Packaging and Packaging Waste Regulation represents the single most consequential demand catalyst: its requirement that flexible plastic packaging, the category most resistant to mechanical recycling due to multi-layer construction and food contamination, achieve minimum chemically recycled content thresholds by 2030 effectively mandates the construction of pyrolysis and solvolysis capacity at a scale the industry has not yet achieved. This is compounded by the EU’s Single-Use Plastics Directive, the Corporate Sustainability Reporting Directive (CSRD) requirements for companies to disclose and reduce plastic waste, and the emerging EU Ecodesign for Sustainable Products Regulation (ESPR) which will set recyclability requirements for products placed on the EU market. In North America, EPR legislation enacted in California, Oregon, Colorado, and Maine is redirecting packaging producer fees toward advanced recycling infrastructure, while the US EPA’s National Recycling Strategy explicitly identifies chemical recycling as a necessary complement to mechanical systems. The compounding effect of these regulatory instruments is to create a regulatory floor for chemically recycled feedstock demand that insulates the market from virgin polymer price cycles, a structural advantage that was entirely absent during the industry’s first wave of investment in 2015–2019.
- Beyond regulatory compulsion, the market is being reshaped by a profound shift in the strategic calculus of the global petrochemical and consumer goods industries, both of which have independently concluded that chemical recycling is no longer a corporate social responsibility initiative but a core business continuity requirement. For petrochemical companies including BASF, LyondellBasell, Sabic, Ineos, and Dow, chemical recycling represents the most technically credible pathway to decarbonising their feedstock base without retiring existing cracker and polymer plant assets, chemically recycled pyrolysis oil can be co-processed in existing steam crackers alongside naphtha, producing certified circular polymers without fundamental process modification. The capital efficiency of this ‘drop-in’ integration model, relative to greenfield bio-based or hydrogen-based feedstock alternatives, is a powerful economic argument for accelerating investment. For consumer goods and retail companies facing rapidly escalating Extended Producer Responsibility fees, plastic packaging taxes in the UK and several EU member states, and shareholder ESG scrutiny, the willingness-to-pay premium for certified circular packaging, typically 20–50% above conventional polymer prices, has proved more resilient than many analysts anticipated, providing the revenue foundation for viable project economics at commercial scale. The maturation of mass-balance chain-of-custody certification frameworks, including ISCC PLUS, REDcert, and the emerging CEN EN 15343 extension for chemical recycling, has been critical in validating this premium for brand owners, retailers, and regulators alike.
- The third major growth driver is the accelerating innovation pipeline across multiple chemical recycling technology pathways that is progressively expanding the range of plastic waste streams that can be economically processed and the quality of outputs that can be achieved. Catalytic pyrolysis, in particular, has seen significant advances in catalyst design, zeolite-based systems, bifunctional metal-acid catalysts, and ex-situ catalytic upgrading approaches, that are improving the selectivity toward higher-value olefin and aromatic fractions while reducing char and gas yields, directly improving process economics. In enzymatic depolymerisation, Carbios has demonstrated industrial-scale PET depolymerisation using a thermostable leaf-branch compost cutinase (LCC-ICCG) enzyme that achieves over 90% monomer yield from post-consumer PET waste including coloured and opaque bottles, a performance level that challenges the traditional assumption that enzymatic routes are inherently less economical than thermal processes for polyesters. The emergence of AI-assisted process optimisation for continuous pyrolysis reactors, digital twin modelling for feedstock variability management, and advanced sensor-based quality control systems for pyrolysis oil fractionation is further accelerating the learning curve, enabling operators to extract higher value from variable waste feedstocks while maintaining output specifications required by cracker co-processing agreements and fuel standards.
Key Challenges
- The most structurally significant challenge confronting the chemical recycling industry is the economics of feedstock supply, specifically, the cost, consistency, and competitive scarcity of clean, sorted, post-consumer plastic waste at the volumes and specifications required for commercial chemical recycling operations. Unlike mechanical recycling, which can operate economically on relatively heterogeneous bale grades, most chemical recycling technologies have specific feedstock requirements: pyrolysis systems typically require low-chlorine, low-PVC polyolefin streams (LDPE, HDPE, PP) to avoid corrosive hydrochloric acid generation; solvolysis processes for PET require clean, separated polyester streams with controlled moisture and contaminant levels; and all chemical recycling technologies are sensitive to the presence of food organic contamination, non-plastic materials, and heavy metal pigments that degrade reactor performance and output quality. The paradox of the market is that the highest-value plastic waste streams, the clean, well-sorted polyolefin and polyester fractions that yield the most economically attractive outputs, are also the streams that are most competitively contested by mechanical recyclers who can process them at lower cost. Chemical recycling therefore frequently faces a residual feedstock positioning problem: it is commercially most needed for the contaminated, mixed, and multi-layer streams that mechanical recycling cannot handle, but these streams are also the most expensive to sort, clean, and pre-process to the specifications required for reliable chemical conversion. Solving this feedstock challenge, through investment in advanced sorting technology, chemical pre-treatment systems, and strategic integration with waste management infrastructure, represents the largest single determinant of whether commercial-scale chemical recycling projects achieve their projected economics.
- A parallel and deeply structural challenge is the energy intensity and carbon accounting complexity of chemical recycling processes, which are increasingly subject to scrutiny from regulators, sustainability teams at brand owner customers, and life-cycle assessment (LCA) practitioners who question whether the climate benefits of chemical recycling are sufficient to justify the significant energy inputs required. Pyrolysis in particular is an endothermic process requiring substantial thermal energy input, typically provided by combusting a portion of the pyrolysis gas produced in the process, and when powered by grid electricity with average carbon intensity, the net carbon savings versus landfill or incineration can be modest, variable, and highly sensitive to the carbon intensity of the energy source and the specific waste stream being processed. The industry’s standard LCA methodology, which allocates all carbon savings to the recycled output under the ‘avoided burden’ approach and assumes displacement of virgin polymer production, is contested by several academic and regulatory bodies who argue it overstates climate benefits relative to a ‘cut-off’ method that only credits the recycling step itself. This methodological dispute has direct commercial consequences: the EU is developing harmonised LCA methodology standards for chemical recycling under the Product Environmental Footprint (PEF) framework, and if the final methodology proves unfavourable, it could erode the regulatory credit value and associated market premium that currently underpins project economics. Simultaneously, the capital intensity of commercial-scale chemical recycling facilities, typically USD 50–300 million per facility for pyrolysis plants in the 20,000–100,000 tonne per annum range, creates a significant financing challenge in a period of elevated interest rates and persistent uncertainty about long-term feedstock costs, offtake pricing, and regulatory stability.
Market Segmentation
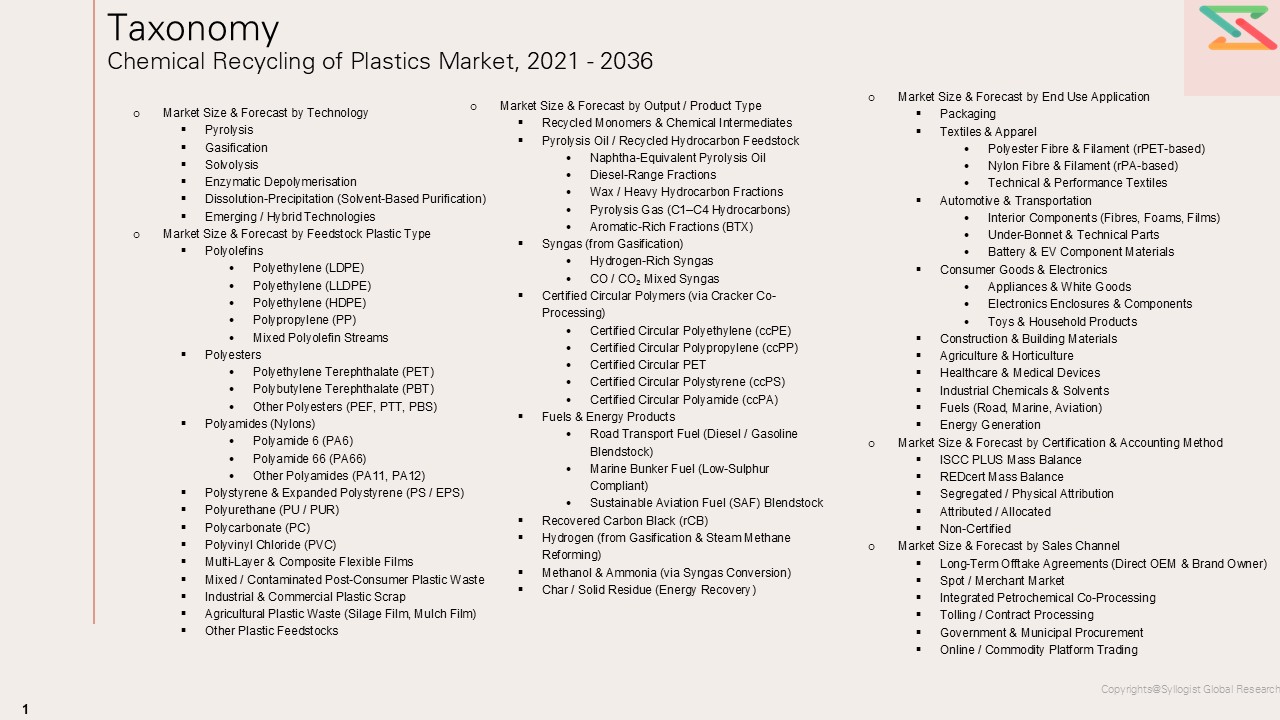
- Segmentation by Technology
- Pyrolysis
- Thermal Pyrolysis
- Catalytic Pyrolysis
- Microwave-Assisted Pyrolysis
- Plasma-Assisted Pyrolysis
- Hydropyrolysis (Hydrocracking)
- Gasification
- Conventional Gasification
- Plasma Gasification
- Supercritical Water Gasification
- Solvolysis
- Glycolysis
- Methanolysis
- Hydrolysis (Acid, Alkaline, Neutral)
- Aminolysis
- Supercritical Fluid Depolymerisation
- Enzymatic Depolymerisation
- Enzymatic PET Hydrolysis
- Enzymatic Polyamide Depolymerisation
- Other / Emerging Technologies
- Dissolution-Precipitation (Solvent-Based Purification)
- Photocatalytic Degradation
- Electrochemical Recycling
- Segmentation by Feedstock Plastic Type
- Polyolefins
- Polyethylene (LDPE, LLDPE, HDPE)
- Polypropylene (PP)
- Mixed Polyolefin Streams
- Polyesters
- Polyethylene Terephthalate (PET)
- Polybutylene Terephthalate (PBT)
- Polytrimethylene Terephthalate (PTT)
- Polyamides (Nylons)
- Polyamide 6 (PA6)
- Polyamide 66 (PA66)
- Polystyrene (PS) & Expanded PS (EPS)
- Polyurethane (PU)
- Polycarbonate (PC)
- Multi-Layer & Composite Films
- Mixed / Contaminated Plastic Waste Streams
- Other Plastic Feedstocks
- Polyolefins
- Segmentation by Output / Product Type
- Recycled Monomers & Chemical Intermediates
- Recycled PTA (Purified Terephthalic Acid)
- Recycled BHET / MEG
- Recycled Caprolactam (for PA6)
- Recycled Hexamethylenediamine (for PA66)
- Recycled Styrene Monomer
- Pyrolysis Oil / Recycled Feedstock
- Naphtha-Equivalent Pyrolysis Oil
- Wax / Heavy Fractions
- Pyrolysis Gas
- Syngas (from Gasification)
- Circular Polymers (via Cracker Co-Processing)
- Certified Circular Polyethylene
- Certified Circular Polypropylene
- Certified Circular PET
- Certified Circular Polystyrene
- Fuels & Energy Products
- Road Transport Fuel
- Marine Bunker Fuel
- Aviation Sustainable Fuel (SAF) Blendstock
- Carbon Black (rCB)
- Hydrogen (from Gasification & Reforming)
- Recycled Monomers & Chemical Intermediates
- Segmentation by End Use Application
- Packaging
- Food-Contact Flexible Packaging
- Food-Contact Rigid Packaging
- Non-Food Flexible Packaging
- Industrial & B2B Packaging
- Textiles & Apparel
- Polyester Fibre & Filament
- Nylon Fibre & Filament
- Technical Textiles
- Automotive & Transportation
- Consumer Goods & Electronics
- Construction & Building Materials
- Agriculture & Horticulture
- Fuels (Road, Marine, Aviation)
- Industrial Chemicals & Solvents
- Packaging
- Segmentation by Certification & Accounting Method
- Mass Balance (ISCC PLUS)
- Mass Balance (REDcert²)
- Segregated / Physical Attribution
- Attributed / Allocated
- Non-Certified
- Segmentation by Sales Channel
- Direct Offtake Agreements (Long-Term)
- Spot / Merchant Market
- Integrated Petrochemical Co-Processing
- Tolling / Contract Processing
- Government & Municipal Procurement
- Pyrolysis
All market revenues are presented in USD and volume in metric tonnes (MT) of plastic waste processed and output produced
Historical Year: 2021–2024 | Base Year: 2025 | Estimated Year: 2026 | Forecast Period: 2027–2036
Key Questions this Study Will Answer
- What are the critical market metrics and forward-looking projections for the Global Chemical Recycling of Plastics Market, including total revenue, processed plastic waste volume (MT), output volume by product category, and average gate fee / feedstock procurement cost, segmented across Technology (Pyrolysis, Gasification, Solvolysis, Enzymatic Depolymerisation), Feedstock Plastic Type (Polyolefins, Polyesters, Polyamides, Polystyrene, Polyurethane, Multi-Layer Films, Mixed Streams), Output/Product Type (Recycled Monomers, Pyrolysis Oil, Syngas, Circular Polymers, Fuels, Carbon Black, Hydrogen), End Use Application (Packaging, Textiles, Automotive, Consumer Goods, Construction, Agriculture, Fuels), Certification Method (ISCC PLUS mass balance, REDcert², Segregated), and Sales Channel (Long-Term Offtake, Spot Market, Integrated Co-Processing, Tolling)?
- How do supply–demand fundamentals and technology economics vary across key regions and major end-use industries, and what role do regulatory mandates (EU PPWR, Single-Use Plastics Directive, US EPR legislation, UK Plastic Packaging Tax), brand owner recycled content commitments, mass-balance certification frameworks (ISCC PLUS, REDcert², CEN EN 15343), post-consumer plastic waste collection infrastructure, feedstock pre-treatment costs, and proximity to petrochemical cracker assets play in shaping regional competitive advantage, investment attractiveness, and technology adoption rates across the pyrolysis, solvolysis, and enzymatic depolymerisation segments?
- In what ways are feedstock cost and availability constraints, covering clean polyolefin bales, post-consumer PET flake, contaminated flexible film, mixed rigid plastics, multi-layer packaging waste, and industrial plastic scrap, influencing process economics, gate fee structures, yield projections, output quality specifications, and technology selection decisions, and how are leading operators addressing feedstock security through long-term supply agreements with waste management companies, vertical integration into sorting and pre-treatment, strategic co-location with material recovery facilities, and proprietary feedstock pre-processing technologies?
- Who are the leading global chemical recycling technology developers, commercial facility operators, petrochemical co-processors, and certification bodies, and how do they benchmark across key dimensions including plastic waste processing capacity (tonnes per annum), technology readiness level (TRL), output yield and quality, feedstock contaminant tolerance, energy intensity (GJ per tonne of output), carbon footprint (CO₂e per tonne of output versus virgin polymer), capital cost per tonne of capacity (USD/MT), operational cost structure, offtake agreement portfolio, certification status, and geographic expansion pipeline?
- What strategic insights emerge from primary discussions with chemical recycling technology licensors, facility operators, petrochemical feedstock buyers, brand owner procurement teams, waste management and sorting facility operators, EPR scheme administrators, and certification body representatives regarding technology scale-up risks and mitigation strategies, feedstock specification evolution as waste streams change with EPR policy implementation, willingness-to-pay dynamics for certified circular content across different end-use markets, the regulatory risk surrounding LCA methodology harmonisation under the EU Product Environmental Footprint framework, competitive dynamics between chemical recycling and alternative plastic waste valorisation pathways including mechanical recycling, energy recovery, and bio-based polymer substitution, and the critical success factors differentiating projects that have achieved bankable project finance from those that have not?
- Market Overview
- Product Overview
- Research Methodology
- Executive Summary
- Market Dynamics
- Market Dynamics (Drivers, Restraints, Opportunities, Challenges, Porter’s Five Forces Analysis, PESTLE Analysis)
- Market Trends & Developments
- Risk Assessment Framework
- Political / Geopolitical Risk
- Feedstock Supply & Waste Collection Risk
- Environmental, Regulatory & LCA Methodology Risk
- Financial / Market & Technology Scale-Up Risk
- Regulatory Framework & Standards
- Global Regulatory Overview
- Key Regulations by Region
- EU: Packaging & Packaging Waste Regulation (PPWR), Single-Use Plastics Directive, CSRD, ESPR
- EU: Circular Economy Action Plan, Green Deal Industrial Plan
- USA: EPA National Recycling Strategy, State EPR Legislation (CA, OR, CO, ME), IRA Tax Credits
- UK: Plastic Packaging Tax, Extended Producer Responsibility Scheme
- China: National Plastics Ban, Green Development Guidelines, Dual Carbon Policy
- India: Plastic Waste Management Rules, EPR for Plastic Packaging
- Japan: Plastic Resource Circulation Act
- Mass Balance & Chain-of-Custody Certification Standards
- ISCC PLUS (International Sustainability & Carbon Certification)
- REDcert² (Renewable Energy Directive Certification)
- CEN EN 15343 Extension for Chemical Recycling
- ASTM D7611 / D7029 Resin Identification
- ISO 15270: Plastics: Recycling Framework
- Emission Standards & Environmental Compliance
- Industrial Emissions Directive (IED)EU
- VOC, Dioxin & Furan Emission Limits for Pyrolysis & Gasification
- Wastewater & Effluent Discharge Standards
- Landfill Diversion & Extended Producer Responsibility Targets
- Sustainability & ESG Compliance
- Life Cycle Assessment (LCA) Methodology: EU PEF Framework
- Scope 3 Emissions Accounting for Post-Consumer Plastic Waste
- Science Based Targets Initiative (SBTi) Alignment
- CSRD Mandatory Sustainability Disclosures
- Regulatory Impact on Market
- Global Chemical Recycling of Plastics Market Outlook
- Market Size & Forecast by Value
- Market Size & Forecast by Volume (Metric Tonnes Processed)
- Market Size & Forecast by Technology
- Pyrolysis
- Thermal Pyrolysis
- Catalytic Pyrolysis
- Microwave-Assisted Pyrolysis
- Plasma-Assisted Pyrolysis
- Hydropyrolysis (Hydrocracking)
- Gasification
- Conventional / Entrained-Flow Gasification
- Plasma Gasification
- Supercritical Water Gasification
- Solvolysis
- Glycolysis
- Methanolysis
- Hydrolysis (Acid, Alkaline, Neutral / Enzymatic)
- Aminolysis
- Supercritical Fluid Depolymerisation
- Enzymatic Depolymerisation
- Enzymatic PET Hydrolysis (LCC-ICCG & Variants)
- Enzymatic Polyamide Depolymerisation
- Enzymatic Polyurethane Degradation
- Dissolution-Precipitation (Solvent-Based Purification)
- CreaSolv® Process (PolyStyreneLoop)
- PureCycle FEPS Process (Polypropylene)
- Other Proprietary Dissolution Processes
- Emerging / Hybrid Technologies
- Photocatalytic Degradation
- Electrochemical Recycling
- Thermochemical Reforming with Carbon Capture
- Pyrolysis
- Market Size & Forecast by Feedstock Plastic Type
- Polyolefins
- Polyethylene (LDPE)
- Polyethylene (LLDPE)
- Polyethylene (HDPE)
- Polypropylene (PP)
- Mixed Polyolefin Streams
- Polyesters
- Polyethylene Terephthalate (PET)
- Polybutylene Terephthalate (PBT)
- Other Polyesters (PEF, PTT, PBS)
- Polyamides (Nylons)
- Polyamide 6 (PA6)
- Polyamide 66 (PA66)
- Other Polyamides (PA11, PA12)
- Polystyrene & Expanded Polystyrene (PS / EPS)
- Polyurethane (PU / PUR)
- Polycarbonate (PC)
- Polyvinyl Chloride (PVC)
- Multi-Layer & Composite Flexible Films
- Mixed / Contaminated Post-Consumer Plastic Waste
- Industrial & Commercial Plastic Scrap
- Agricultural Plastic Waste (Silage Film, Mulch Film)
- Other Plastic Feedstocks
- Polyolefins
- Market Size & Forecast by Output / Product Type
- Recycled Monomers & Chemical Intermediates
- Recycled Purified Terephthalic Acid (rPTA)
- Recycled BHET / Mono-Ethylene Glycol (rMEG)
- Recycled Dimethyl Terephthalate (rDMT)
- Recycled Caprolactam (for PA6)
- Recycled Hexamethylenediamine / Adipic Acid (for PA66)
- Recycled Styrene Monomer (rSM)
- Recycled Bisphenol A (rBPA) & Diphenyl Carbonate
- Pyrolysis Oil / Recycled Hydrocarbon Feedstock
- Naphtha-Equivalent Pyrolysis Oil
- Diesel-Range Fractions
- Wax / Heavy Hydrocarbon Fractions
- Pyrolysis Gas (C1–C4 Hydrocarbons)
- Aromatic-Rich Fractions (BTX)
- Syngas (from Gasification)
- Hydrogen-Rich Syngas
- CO / CO₂ Mixed Syngas
- Certified Circular Polymers (via Cracker Co-Processing)
- Certified Circular Polyethylene (ccPE)
- Certified Circular Polypropylene (ccPP)
- Certified Circular PET
- Certified Circular Polystyrene (ccPS)
- Certified Circular Polyamide (ccPA)
- Fuels & Energy Products
- Road Transport Fuel (Diesel / Gasoline Blendstock)
- Marine Bunker Fuel (Low-Sulphur Compliant)
- Sustainable Aviation Fuel (SAF) Blendstock
- Recovered Carbon Black (rCB)
- Hydrogen (from Gasification & Steam Methane Reforming)
- Methanol & Ammonia (via Syngas Conversion)
- Char / Solid Residue (Energy Recovery)
- Recycled Monomers & Chemical Intermediates
- Market Size & Forecast by End Use Application
- Packaging
- Food-Contact Flexible Packaging
- Food-Contact Rigid Packaging
- Non-Food Flexible Packaging
- Non-Food Rigid Packaging
- Industrial & B2B Packaging
- E-Commerce & Transit Packaging
- Textiles & Apparel
- Polyester Fibre & Filament (rPET-based)
- Nylon Fibre & Filament (rPA-based)
- Technical & Performance Textiles
- Automotive & Transportation
- Interior Components (Fibres, Foams, Films)
- Under-Bonnet & Technical Parts
- Battery & EV Component Materials
- Consumer Goods & Electronics
- Appliances & White Goods
- Electronics Enclosures & Components
- Toys & Household Products
- Construction & Building Materials
- Agriculture & Horticulture
- Healthcare & Medical Devices
- Industrial Chemicals & Solvents
- Fuels (Road, Marine, Aviation)
- Energy Generation
- Packaging
- Market Size & Forecast by Certification & Accounting Method
- ISCC PLUS Mass Balance
- REDcert Mass Balance
- Segregated / Physical Attribution
- Attributed / Allocated
- Non-Certified
- Market Size & Forecast by Sales Channel
- Long-Term Offtake Agreements (Direct OEM & Brand Owner)
- Spot / Merchant Market
- Integrated Petrochemical Co-Processing
- Tolling / Contract Processing
- Government & Municipal Procurement
- Online / Commodity Platform Trading
- Market Size & Forecast by Region
- North America
- Europe
- Asia-Pacific
- Middle East & Africa
- Latin America
- Asia-Pacific Chemical Recycling of Plastics Market Outlook
- Market Size & Forecast
- By Value
- By Volume (Metric Tonnes Processed)
- By Technology
- By Feedstock Plastic Type
- By Output / Product Type
- By End Use Application
- By Certification & Accounting Method
- By Sales Channel
- Market Size & Forecast
- Europe Chemical Recycling of Plastics Market Outlook
- Market Size & Forecast
- By Value
- By Volume (Metric Tonnes Processed)
- By Technology
- By Feedstock Plastic Type
- By Output / Product Type
- By End Use Application
- By Certification & Accounting Method
- By Sales Channel
- Market Size & Forecast
- North America Chemical Recycling of Plastics Market Outlook
- Market Size & Forecast
- By Value
- By Volume (Metric Tonnes Processed)
- By Technology
- By Feedstock Plastic Type
- By Output / Product Type
- By End Use Application
- By Certification & Accounting Method
- By Sales Channel
- Market Size & Forecast
- Latin America Chemical Recycling of Plastics Market Outlook
- Market Size & Forecast
- By Value
- By Volume (Metric Tonnes Processed)
- By Technology
- By Feedstock Plastic Type
- By Output / Product Type
- By End Use Application
- By Certification & Accounting Method
- By Sales Channel
- Market Size & Forecast
- Middle East & Africa Chemical Recycling of Plastics Market Outlook
- Market Size & Forecast
- By Value
- By Volume (Metric Tonnes Processed)
- By Technology
- By Feedstock Plastic Type
- By Output / Product Type
- By End Use Application
- By Certification & Accounting Method
- By Sales Channel
- Market Size & Forecast
- Country Wise* Chemical Recycling of Plastics Market Outlook
- Market Size & Forecast
- By Value
- By Volume (Metric Tonnes Processed)
- By Technology
- By Feedstock Plastic Type
- By Output / Product Type
- By End Use Application
- By Certification & Accounting Method
- By Sales Channel
- Market Size & Forecast
- *Countries Analyzed in the Syllogist Global Research Portfolio: Germany, United States, Netherlands, United Kingdom, France, Belgium, Japan, South Korea, China, India, Australia, Canada, Brazil, Italy, Poland, Sweden, Norway, Denmark, Finland, Spain, Mexico, Singapore, Malaysia, Indonesia, South Africa, UAE, Saudi Arabia, Turkey, Thailand, Vietnam
- Technology Analysis
- Conventional vs Advanced Chemical Recycling Technology Comparison
- Mechanical Recycling vs Chemical Recycling
- Technology Readiness Level (TRL) Assessment by Process Route
- Capacity & Yield Benchmarking Across Technology Pathways
- Energy Intensity & Carbon Footprint by Technology (GJ/tonne, CO₂e/tonne)
- Technology Deep-Dives
- Pyrolysis
- Gasification
- Glycolysis & Methanolysis
- Enzymatic Depolymerisation
- Dissolution-Precipitation
- Emerging Technologies & Innovation Pipeline
- AI & Machine Learning for Process Optimisation & Feedstock Management
- Digital Twin Applications for Chemical Recycling Reactors
- Advanced Sorting & Pre-Treatment Technologies (NIR, AI Vision, Robotic Sorting)
- Thermochemical Reforming with Carbon Capture & Utilisation (CCU)
- Plasma & Supercritical Fluid Processing Advances
- Conventional vs Advanced Chemical Recycling Technology Comparison
- Value Chain & Supply Chain Analysis
- Plastic Waste Generators (Municipal, Industrial, Commercial, Agricultural)
- Waste Collection & Aggregation Infrastructure
- Sorting, Washing & Pre-Treatment Facilities (MRFs)
- Chemical Recycling Technology Operators & Facility Owners
- Petrochemical Co-Processors & Cracker Operators
- Certified Circular Polymer Producers & Distributors
- End-Use Brand Owners, OEMs & Compounders
- Certification Bodies & Regulatory Agencies
- Ecosystem Map
- Supply Chain Analysis
- Feedstock Sourcing
- Feedstock Pre-Treatment
- Contaminant Management
- Supply Chain Risks & Disruptions
- Feedstock Competition with Mechanical Recyclers
- Geographic Concentration of Waste Stream Availability
- Trade Flow Analysis
- Major Exporting Countries (Plastic Waste, Pyrolysis Oil, Circular Polymers)
- Major Importing Countries
- Basel Convention Restrictions on Plastic Waste Trade
- Import-Export Dynamics & Policy Constraints
- Pricing Analysis
- Gate Fee Analysis by Feedstock Type & Waste Quality
- Gate Fees for Clean Sorted Polyolefin Streams (USD/tonne)
- Gate Fees for Contaminated Mixed Plastic Waste (USD/tonne)
- Gate Fees for Post-Consumer PET Flake (USD/tonne)
- Gate Fees for Multi-Layer Flexible Film (USD/tonne)
- Output / Product Pricing by Category
- Pyrolysis Oil / Recycled Naphtha Price vs Virgin Naphtha (USD/tonne)
- Certified Circular Polymer Price Premium vs Virgin Polymer (%)
- Recycled PTA & MEG Price vs Virgin Equivalents (USD/tonne)
- Recovered Carbon Black (rCB) Pricing vs Virgin Carbon Black
- Hydrogen from Gasification
- Price Tier Analysis
- Commodity Chemical Recycling Outputs (Fuel-Grade Pyrolysis Oil)
- Mid-Tier Recycling Outputs (Chemical Feedstock-Grade Pyrolysis Oil)
- Premium Circular Outputs (Certified Circular Polymers, Food-Contact Grade)
- Specialty High-Purity Monomers (rPTA, rCaprolactam)
- Willingness-to-Pay Premium Analysis by End Use Sector
- Food & Beverage Packaging
- Premium Fashion & Apparel
- Automotive OEMs
- Gate Fee Analysis by Feedstock Type & Waste Quality
- Sustainability, LCA & Carbon Accounting
- Life Cycle Assessment (LCA) Methodology
- Carbon Footprint Benchmarking by Technology (CO₂e/tonne output)
- Energy Intensity Analysis
- EU Product Environmental Footprint (PEF) Framework
- Chemical Recycling vs Mechanical Recycling
- Chemical Recycling vs Incineration with Energy Recovery
- Circular Economy KPIs
- ESG Reporting Frameworks Relevant to Chemical Recycling Operators
- Go-to-Market & Distribution
- Sales Channel Overview
- Long-Term Offtake & Off-Take Agreement Structures
- Spot Market & Commodity Brokerage
- Integrated Petrochemical Co-Processing Partnerships
- Tolling & Contract Processing Models
- Direct Brand Owner Supply Agreements (with Mass Balance Certification)
- Mass Balance Chain-of-Custody
- Power-of-Attorney & Attributed Volume Tracking Systems
- Distribution Strategies by Leading Technology Operators
- Role of EPR Scheme Fees in Financing Chemical Recycling Offtake
- Sales Channel Overview
- Competitive Landscape
- Market Structure & Concentration
- Market Fragmentation Level (Technology Developers vs Commercial Operators)
- Top 10 Players by Installed Processing Capacity (Tonnes per Annum)
- HHI (Herfindahl–Hirschman Index) Concentration Analysis by Technology Segment
- Competitive Intensity Map (Technology vs Geography)
- Player Classification
- Pioneer Technology Developers (Carbios, PureCycle, Plastic Energy, Brightmark)
- Integrated Petrochemical Players (BASF, LyondellBasell, Sabic, Ineos, Dow, Neste)
- Specialist Pyrolysis Operators (Renewlogy, Quantafuel, Wastefront, Enval)
- Solvolysis & Depolymerisation Specialists (Loop Industries, Gr3n, Ioniqa)
- Waste Management & Infrastructure Players (Veolia, Suez, Remondis)
- Emerging Players & Start-Ups
- Regional Players
- Competitive Analysis Frameworks
- Market Share Analysis by Technology & Geography
- Company Profile
- Company Overview & HQ
- Technology Platform & Process Route
- Processing Capacity (Current & Pipeline)
- Feedstock Specifications & Waste Streams Processed
- Output Products & Quality Specifications
- Revenue & Chemical Recycling Segment Revenue
- Geographic Presence & Expansion Plans
- Certification Status (ISCC PLUS, REDcert², Others)
- Offtake Agreements & Key Customer Partnerships
- Recent Developments (M&A, Investments, Plant Commissioning, Partnerships)
- SWOT Analysis
- Strategic Focus Areas
- Competitive Positioning Map (Technology Maturity vs Scale Achieved)
- Technology Licensing & IP Portfolio Analysis
- Market Structure & Concentration
- Investment & Project Finance Landscape
- Capital Cost Benchmarking by Technology & Scale
- Pyrolysis Plant CapEx (USD/tonne capacity)
- Gasification Plant CapEx
- Solvolysis / Enzymatic Depolymerisation Plant CapEx
- Project Finance Structures
- Government Grants, Subsidies & Tax Incentives by Region
- EU Innovation Fund & Horizon Europe Grants
- US IRA Advanced Manufacturing Tax Credits & DOE Grants
- UK Green Investment Schemes
- Venture Capital & Private Equity Activity (2020–2026)
- Strategic Corporate Investment & JV Formations
- Project Pipeline: Announced, Under Construction, Operational (2025–2030)
- Capital Cost Benchmarking by Technology & Scale
- Strategic Recommendations
- For Chemical Recycling Technology Developers & Operators
- Technology & Process Optimisation Strategy
- Feedstock Security & Pre-Treatment Integration Strategy
- Certification & Mass Balance Chain-of-Custody Strategy
- Offtake & Commercial Partnership Strategy
- Scale-Up, Licensing & Geographic Expansion Strategy
- Sustainability & LCA Differentiation Strategy
- M&A, JV & Partnership Strategy
- For Petrochemical Companies & Polymer Producers
- Circular Feedstock Integration & Co-Processing Strategy
- Certified Circular Portfolio Development
- Feedstock Diversification & Supply Chain Resilience
- For Brand Owners, Retailers & Consumer Goods Companies
- Recycled Content Procurement & Offtake Agreement Strategy
- Mass Balance Certification Selection & Communication
- Chemical vs Mechanical Recycling Portfolio Allocation
- For Waste Management, Sorting & MRF Operators
- Feedstock Upgrading for Chemical Recycling Premium
- Strategic Partnership Models with Technology Operators
- For Investors & Private Equity
- High-Priority Investment Themes by Technology & Geography
- M&A Opportunity Map: Technology vs Infrastructure vs Feedstock
- Risk-Return Analysis by Stage (Pilot, Demo, Commercial)
- Geographic Investment Priorities
- Key Risk Considerations (LCA Policy, Feedstock, Offtake, Technology)
- For Governments & Regulators
- Policy Recommendations to Accelerate Chemical Recycling Deployment
- LCA & Certification Methodology Harmonisation
- EPR Scheme Design to Fund Chemical Recycling Infrastructure
- Public Procurement & Green Public Purchasing Standards
- R&D Support, Innovation Grants & Demonstration Plant Funding
- White Space & Opportunity Analysis
- Unmet Market Needs by Feedstock & End Use
- Emerging Business Models (Chemical Recycling-as-a-Service, Tolling)
- Technology White Spaces
- Geographic White Spaces
- Strategic Priority Matrix & Roadmap
- Near-term (2025–2028)
- Mid-term (2029–2032)
- Long-term (2033–2036)
- For Chemical Recycling Technology Developers & Operators