Market Definition
Rubber Process Oils (RPOs) are specialty petroleum-derived products used in the formulation and processing of rubber compounds to improve workability, dispersion of fillers, and performance characteristics of finished products. They play a crucial role in tire manufacturing, industrial rubber goods, footwear, and automotive components. Over the last two years, the global RPO market has been influenced significantly by fluctuations in crude oil prices, changing environmental regulations on aromatic content, and evolving demand from tire and automotive industries.
Market Insights
Due to geopolitical factors, increased crude and feedstock prices, reduced refinery operating rates, and limited availability of aromatic extracts, RPO demand declined in 2021 and 2022. Although demand is projected to recover in 2023 with the stabilization of energy markets and feedstock prices, overall consumption will likely remain below 2020 levels. Other reasons for the drop in demand, in addition to geopolitical and economic challenges, include the slowdown in global automobile and tire production, supply chain disruptions, and the shift toward sustainable low-aromatic process oils due to regulatory pressure. In certain markets, such as Europe, environmental compliance costs and refinery conversions have reduced the availability of conventional aromatic process oils.
According to industry estimates, global tire production declined in 2022 compared to 2021, affecting RPO consumption directly. Regulatory policies will have a medium-to-long-term impact on product mix and demand. Though short-term volatility persists, the global RPO market is projected to expand steadily at a CAGR of 3.4% from 2023 to 2030, supported by recovery in tire manufacturing and industrial rubber production. Asia-Pacific and Latin America will be the primary growth engines due to their expanding automotive production and rubber goods industries. The push for eco-friendly formulations and treated distillate aromatic extracts (TDAE) will further shape market growth dynamics.
Because most countries depend heavily on refinery by-products for RPO feedstock, the market remains vulnerable to refinery configuration changes and crude oil supply disruptions. However, compared to base oils or fuel-grade distillates, RPOs benefit from stable demand from the tire and rubber industries. Demand for low-aromatic and treated process oils declined less in 2021–2022 than that of conventional aromatic oils, as major tire manufacturers shifted toward REACH-compliant products. Two major factors supported this:
- Most tire producers in Asia and Europe increasingly use TDAE and naphthenic oils for environmental compliance and better performance.
- In case of feedstock constraints, refineries prioritize production of cleaner process oil grades due to stronger downstream demand and higher margins.
Demand for treated and low-aromatic process oils is expected to rebound with prices stabilizing in 2023, growing moderately after consecutive declines during 2021 and 2022. Assuming an optimistic scenario, consumption is likely to surpass pre-pandemic levels by the end of the forecast period. Naphthenic and paraffinic process oils are expected to gain greater traction due to their better color stability, low volatility, and compatibility with synthetic rubber compounds. However, environmental restrictions and refinery rationalization in Europe may limit aromatic process oil availability in the medium-to-long term.
Despite strong production capability in certain countries, several markets, including North America, remain import-dependent, particularly for TDAE and specialized low-aromatic oils. Limited supply and price escalation during 2021–2022 affected profitability for compounders and tire producers, leading to temporary adjustments in production. Demand is expected to recover in 2023, with steady growth thereafter, supported by the resumption of vehicle production, increased replacement tire demand, and recovery in industrial and construction activities. Long-term demand will be supported by innovation in tire performance and rubber product design, although increasing adoption of bio-based plasticizers and sustainable alternatives may partially offset conventional RPO use.
The competitive ecosystem remains moderately consolidated, with major oil companies and specialty chemical manufacturers controlling most of the global capacity. However, regional producers are expanding rapidly in Asia-Pacific to meet local demand and reduce dependency on imports. The COVID-19 pandemic and subsequent supply chain disruptions, along with the Russia–Ukraine conflict, had a notable impact on supply logistics and pricing. Nonetheless, most global producers have improved utilization rates, and while sales volumes declined in 2022, revenues increased substantially due to higher prices and the shift toward higher-value, compliant grades.
Market Dynamics: Drivers
The growth in automotive and tire manufacturing, industrial rubber products, and construction activities continues to drive the RPO market. Rising consumer demand for fuel-efficient, high-performance tires and durable rubber products is increasing the need for advanced process oil grades. The push for product innovation, enhanced processing characteristics, and improved end-use performance supports the continued use of RPOs, especially in emerging economies.
Market Dynamics: Challenges
Volatile crude oil prices, tightening environmental regulations, and refinery feedstock constraints remain major challenges. The global shift toward sustainable and bio-based alternatives could limit growth in conventional RPO demand. Additionally, energy-intensive refining processes and changing refinery economics may constrain the availability of key feedstocks, creating price fluctuations and short-term supply shortages.
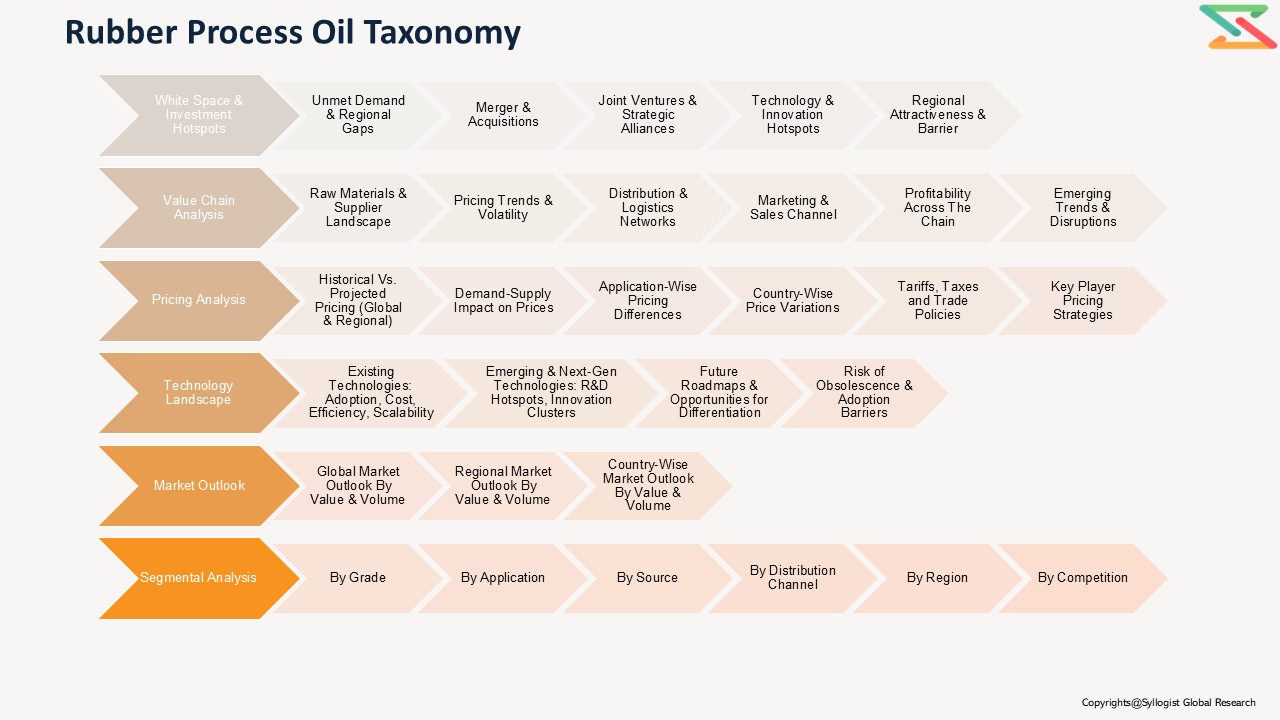
Market Segmentation
Based on Product Type, the Global Rubber Process Oil Market is segmented into
- Aromatic Process Oil (APO)
- Naphthenic Process Oil (NPO)
- Paraffinic Process Oil (PPO)
- Treated Distillate Aromatic Extract (TDAE)
- Low-Aromatic Process Oils (LAPO)
- Others
Based on Application, the Global Rubber Process Oil Market is segmented into
- Tire Manufacturing (Tread, Sidewall, Inner Liner)
- Industrial Rubber Products
- Automotive Components
- Adhesives & Sealants
- Footwear
- Others
Based on End-Use Industry, the Global Rubber Process Oil Market is segmented into
- Automotive & Transportation
- Industrial Manufacturing
- Construction
- Consumer Goods
- Others
Based on Geography, the Global Rubber Process Oil Market is segmented into
- North America
- Europe
- Asia-Pacific
- Latin America
- Middle East & Africa
All market revenue has been given in US Dollar, while the market volumes are given in tons.
Historical Year: 2021–2024
Base Year: 2025
Estimated Year: 2026
Forecast Period: 2027–2031
Key Questions this Study will Answer
- What are the key overall market statistics or market estimates (Market Overview, Market Size, By Value, Market Size, By Volume, Forecast Numbers, Market Segmentation, Market Shares) of the Global Rubber Process Oil Market?
- What is the region-wise industry size, growth drivers, challenges, and key market trends?
What are the key innovations, opportunities, current and future trends, and regulations in the Global Rubber Process Oil Market? - Who are the key competitors, what are their strengths and weaknesses, and how do they perform in the Global Rubber Process Oil Market based on competitive benchmarking matrix?
- What are the key results derived from the market surveys conducted during the Global Rubber Process Oil Market study?
- Market Foundations & Dynamics
- Introduction
1.1. Product Overview (Definition & Scope of Rubber Process Oil)
1.1.2. Petroleum Derivative Overview (Refining → Extraction → Blending)
1.1.3. Research Methodology
1.1.4. Executive Summary
1.1.5. Major Trends Shaping the Market
1.1.6. Short-Term vs. Long-Term Opportunities
1.1.7. Comparison of Aromatic, Naphthenic, and Paraffinic Oils
1.1.8. Scenario Planning (Base, Optimistic, Conservative)
1.1.9. Sensitivity Analysis (Crude Oil Price, Demand Elasticity, Regulations)
1.1.10. Identification of Regional Investment Hotspots - Market Dynamics
(Drivers, Restraints, Opportunities, Challenges, Porter’s Five Forces Analysis, PESTLE Analysis) - Market Ecosystem & Value Chain
3.1. Overview of Value Chain Participants
1.3.1.1. Refiners & Base Oil Producers
1.3.1.2. Additive & Blending Companies
1.3.1.3. Rubber & Tire Manufacturers
1.3.1.4. Non-Tire Rubber Product Manufacturers (Belts, Hoses, Footwear, etc.)
1.3.1.5. Traders / Distributors / Logistics Providers
1.3.2. Flow of Value and Material Through the Chain
1.3.3. Value Addition and Margins at Each Stage
1.3.3.1. Feedstock Procurement
1.3.3.2. Refining / Processing
1.3.3.3. Blending / Customization
1.3.3.4. Distribution / Sales
1.3.4. Integration Trends (Oil Company–Controlled vs. Independent Suppliers)
1.3.5. Impact of Vertical Integration on Profitability - Mapping of Roles and Interdependencies
(Refiners, Compounders, OEMs, Regulatory Bodies) - Market Trends & Developments
5.1. Shift Toward Low-PAH and Environmentally Safe Oils
1.5.2. Demand–Supply Gaps by Region
1.5.3. Emerging Markets & Investment Hotspots
1.5.4. Unmet Needs in Tire & Non-Tire Applications - Risk Assessment Framework
6.1. Political / Geopolitical Risk
1.6.2. Operational Risk (Feedstock & Refinery Constraints)
1.6.3. Environmental Risk (Regulatory Pressure on Aromatic Oils)
1.6.4. Financial Risk (Crude Oil Volatility, Exchange Rates)
- Introduction
- Regulatory Framework & Standards
- Global Regulatory Overview
1.1. EU REACH and PAH Limits (EU Directive 2005/69/EC)
2.1.2. U.S. EPA Regulations & ASTM Standards
2.1.3. China’s Environmental Safety Regulations for Process Oils
2.1.4. India’s BIS Standards for Rubber Process Oils
2.1.5. APAC and Middle East Compliance Landscape - Quality & Certification Requirements (REACH, RoHS, ISO, BIS)
3. Transportation, Storage & Safety Regulations
2.4. Environmental & Liability Considerations
2.5. Traceability, Material Safety Data Sheets (MSDS) & Digital Tracking Trends
- Global Regulatory Overview
- Technology Landscape
- Refining & Production Technologies
1.1. Solvent Extraction and Hydroprocessing
3.1.2. Catalytic Dewaxing & Hydrofinishing Processes
3.1.3. Use of Feedstocks (Crude Oil, Distillates, Residual Oils)
3.2. Process Optimization & Quality Control
3.2.1. PAH Removal & Hydrogenation Efficiency
3.2.2. Additive Blending Technologies
3.3. Emerging Technologies: Bio-Based & Synthetic Process Oils
3.4. Standardization & Specification Trends (Viscosity, Flash Point, Color)
3.5. Innovation Outlook: Sustainable Refining & Low-Emission Processes
- Refining & Production Technologies
- Global, Regional & Country Forecasts (2020–2035)
- Global Rubber Process Oil Market Outlook (Value & Volume)
- Market Share by:
2.1. Oil Type (Aromatic, Naphthenic, Paraffinic, Treated Distillate, Bio-Based)
4.2.2. Application / End-Use Industry
- Tire Manufacturing (Passenger Car, Truck, OTR, 2-Wheeler Tires)
- Non-Tire Rubber (Belts, Hoses, Footwear, Molded Goods, Others)
- Industrial Lubrication & Processing
4.2.3. Grade (TDAE, MES, RAE, Heavy RPO, Light RPO)
4.2.4. Source (Petroleum-Derived vs. Bio-Based)
4.2.5. Distribution Channel (Direct Sales, Traders, Distributors)
4.2.6. Company - Regional & Country Outlook (2020–2035)
3.1. Asia-Pacific (China, India, Japan, South Korea, Indonesia)
4.3.2. North America (U.S., Canada)
4.3.3. Latin America (Brazil, Mexico)
4.3.4. Europe (Germany, UK, France, Italy, Spain)
4.3.5. Middle East & Africa (Saudi Arabia, UAE, South Africa)
- Pricing Analysis
- Overview of Pricing Structures (per ton / per barrel basis)
2. Average Selling Price (ASP) Trends by Oil Type and Region
5.3. Cost Benchmark:
5.3.1. RPO vs. Alternative Plasticizers (Paraffinic Oils, Synthetic Esters, Bio-Oils)
5.3.2. Refinery Transfer Pricing Comparison
5.4. Price Sensitivity by Application (Tire vs. Non-Tire)
5.5. Historical Price Evolution (2015–2025)
5.6. Forecast Pricing Curve (2025–2035)
5.7. Factors Influencing Price:
5.7.1. Crude Oil & Feedstock Costs
5.7.2. Refinery Operating Cost
5.7.3. Transportation & Storage
5.7.4. Environmental Compliance & Testing Cost
5.8. Regional Pricing Differentiation (China vs. EU vs. U.S.)
5.9. Impact of Crude Oil Volatility on RPO Pricing
- Overview of Pricing Structures (per ton / per barrel basis)
- Competition Outlook
- Market Concentration and Fragmentation Level
2. Company Market Shares (Top 10 Players)
6.3. Competitive Strategies
6.3.1. Feedstock Integration & Refinery Control
6.3.2. Product Diversification (Low-PAH, Bio-Based Oils)
6.3.3. Regional Expansion & Joint Ventures
6.4. Benchmarking Matrix (Product Portfolio vs. Cost vs. Integration)
6.5. Recent Developments
6.5.1. Partnerships, M&A, Capacity Expansions, and Strategic Alliances
- Market Concentration and Fragmentation Level
- Cost Structure & Margin Analysis
- Detailed Cost Breakdown
1.1. Crude Oil & Feedstock Procurement
7.1.2. Refining / Hydrogenation
7.1.3. Additive Blending & Quality Testing
7.1.4. Packaging & Logistics
7.1.5. Compliance & Certification Cost
7.2. Average Cost per Stage ($/ton)
7.3. Profitability and Margin Distribution Along Value Chain
7.3.1. Refiner Margin
7.3.2. Distributor Margin
7.3.3. End-User (Rubber Compounder) Margin
7.4. Sensitivity Analysis: Impact of Crude Oil & Regulation on Margins
7.5. Cost Reduction Opportunities via Energy Efficiency & Process Optimization
- Detailed Cost Breakdown
- Business Models & Strategic Insights
- Integrated Refiner-to-Compounder Models
2. Independent RPO Supplier Models
8.3. Contract Manufacturing & Blending Models
8.4. Export-Oriented vs. Domestic-Focused Models
8.5. Strategic Partnerships with Tire & Rubber Manufacturers
8.6. Economic Viability Comparison of Models
8.7. SWOT Analysis of Leading Business Models
- Integrated Refiner-to-Compounder Models
- Investment & Financial Analysis
- CAPEX and OPEX Benchmarks for RPO Production Plants
2. Payback Period and IRR Sensitivity (by Capacity & Region)
9.3. Financial Modeling Assumptions (Feedstock Yield, Refinery Efficiency, Utilization Rate)
9.4. Revenue Streams:
9.4.1. Direct Sales to Tire & Rubber Manufacturers
9.4.2. Export Sales & Trading Margins
9.4.3. By-Product Utilization & Waste Valorization
9.5. Investment Case Studies (Greenfield & Brownfield Projects)
9.6. Funding Landscape: Oil Majors, Private Equity, and Strategic Investors
- CAPEX and OPEX Benchmarks for RPO Production Plants
- Sales & Distribution Channel Analysis
- Overview of Go-to-Market Channels
1.1. Direct Sales (Refinery to End-User)
10.1.2. Indirect Sales via Traders / Distributors
10.1.3. Partnership Models (Refiner + Rubber Manufacturer)
10.1.4. Online / B2B Chemical Trading Platforms
10.2. Channel Share by Region
10.3. Typical Channel Flow Diagram
10.4. Distribution Strategies by Leading Players
10.5. Emerging Trends:
10.5.1. Digital Procurement & Online Marketplaces
10.5.2. Long-Term Supply Contracts with Tire OEMs
- Overview of Go-to-Market Channels
- Strategic Recommendations & Roadmap
- Competitors’ Strategic Initiatives
2. Future Outlook (Next 5–10 Years, Emerging Players, Success Factors)
11.3. Strategic Recommendations
11.3.1. Technology & Feedstock Innovations to Watch
11.3.2. Sustainable & Bio-Based Transition Roadmap (2030–2035)
11.3.3. Strategic Recommendations for Stakeholders
11.4. Rubber Process Oil Market Growth Roadmap
11.4.1. Short-Term (2025–2027)
11.4.2. Mid-Term (2028–2030)
11.4.3. Long-Term (2031–2035)
11.5. Tailored Recommendations for:
11.5.1. RPO Manufacturers & Refiners
11.5.2. Feedstock Suppliers
11.5.3. End Users (Tire, Rubber, Industrial)
11.6. Recommendations on Key Success Factors
11.6.1. Strategic Partnerships & Supply Agreements
11.6.2. Process Efficiency & Digitalization
11.6.3. Regulatory Compliance & Certification Alignment
11.6.4. Investment Readiness & ESG Positioning
- Competitors’ Strategic Initiatives