Market Definition
The Global e-Forecourts Market encompasses the development, ownership, operation, and commercial management of dedicated electric vehicle charging hubs that are purpose-built or comprehensively retrofitted to replicate, and materially enhance, the throughput capacity, service convenience, and multi-revenue amenity experience of conventional petroleum forecourts within a fully electrified public refuelling infrastructure context, serving battery electric vehicle and plug-in hybrid electric vehicle drivers requiring high-power charging across highway corridors, urban and suburban arterial routes, retail and leisure destination catchments, and commercial fleet operator depot environments across all major global markets. An e-forecourt is distinguished from conventional public charging installations by its integration of multiple simultaneous high-power direct current fast charging bays, typically deploying infrastructure operating at output capacities of 150 kilowatts to 400 kilowatts or greater per charger and capable of accommodating six or more vehicles concurrently, within a purpose-designed site that combines charging infrastructure with complementary amenity and retail services including convenience retail, food and beverage concessions, restrooms, loyalty programme integration, digital connectivity, and vehicle services that generate ancillary non-charging revenue streams and justify extended customer dwell time. The market encompasses the complete value chain of e-forecourt development and operation, including site identification and land acquisition, utility grid interconnection engineering and upgrade investment, charging equipment procurement and installation, canopy and civil infrastructure construction, retail and amenity fit-out, renewable energy integration through on-site solar photovoltaic generation and battery energy storage systems, digital payment and energy management platform deployment, ongoing operations and maintenance, and the multi-party commercial structures linking charging network operators, energy retailers, site developers, fuel retail incumbents, and independent e-forecourt specialist developers globally. Key participants include dedicated e-forecourt developers and operators, incumbent petroleum retail and travel centre network operators executing electrification transition strategies, charging equipment manufacturers, electric utilities and renewable power suppliers, quick service restaurant and convenience retail concession brands, commercial fleet telematics and account service providers, and national and supranational regulatory bodies whose alternative fuels infrastructure regulation frameworks and public funding mechanisms govern minimum charging infrastructure deployment obligations and investment incentive structures across road networks in Europe, North America, Asia-Pacific, and emerging global markets.
Market Insights
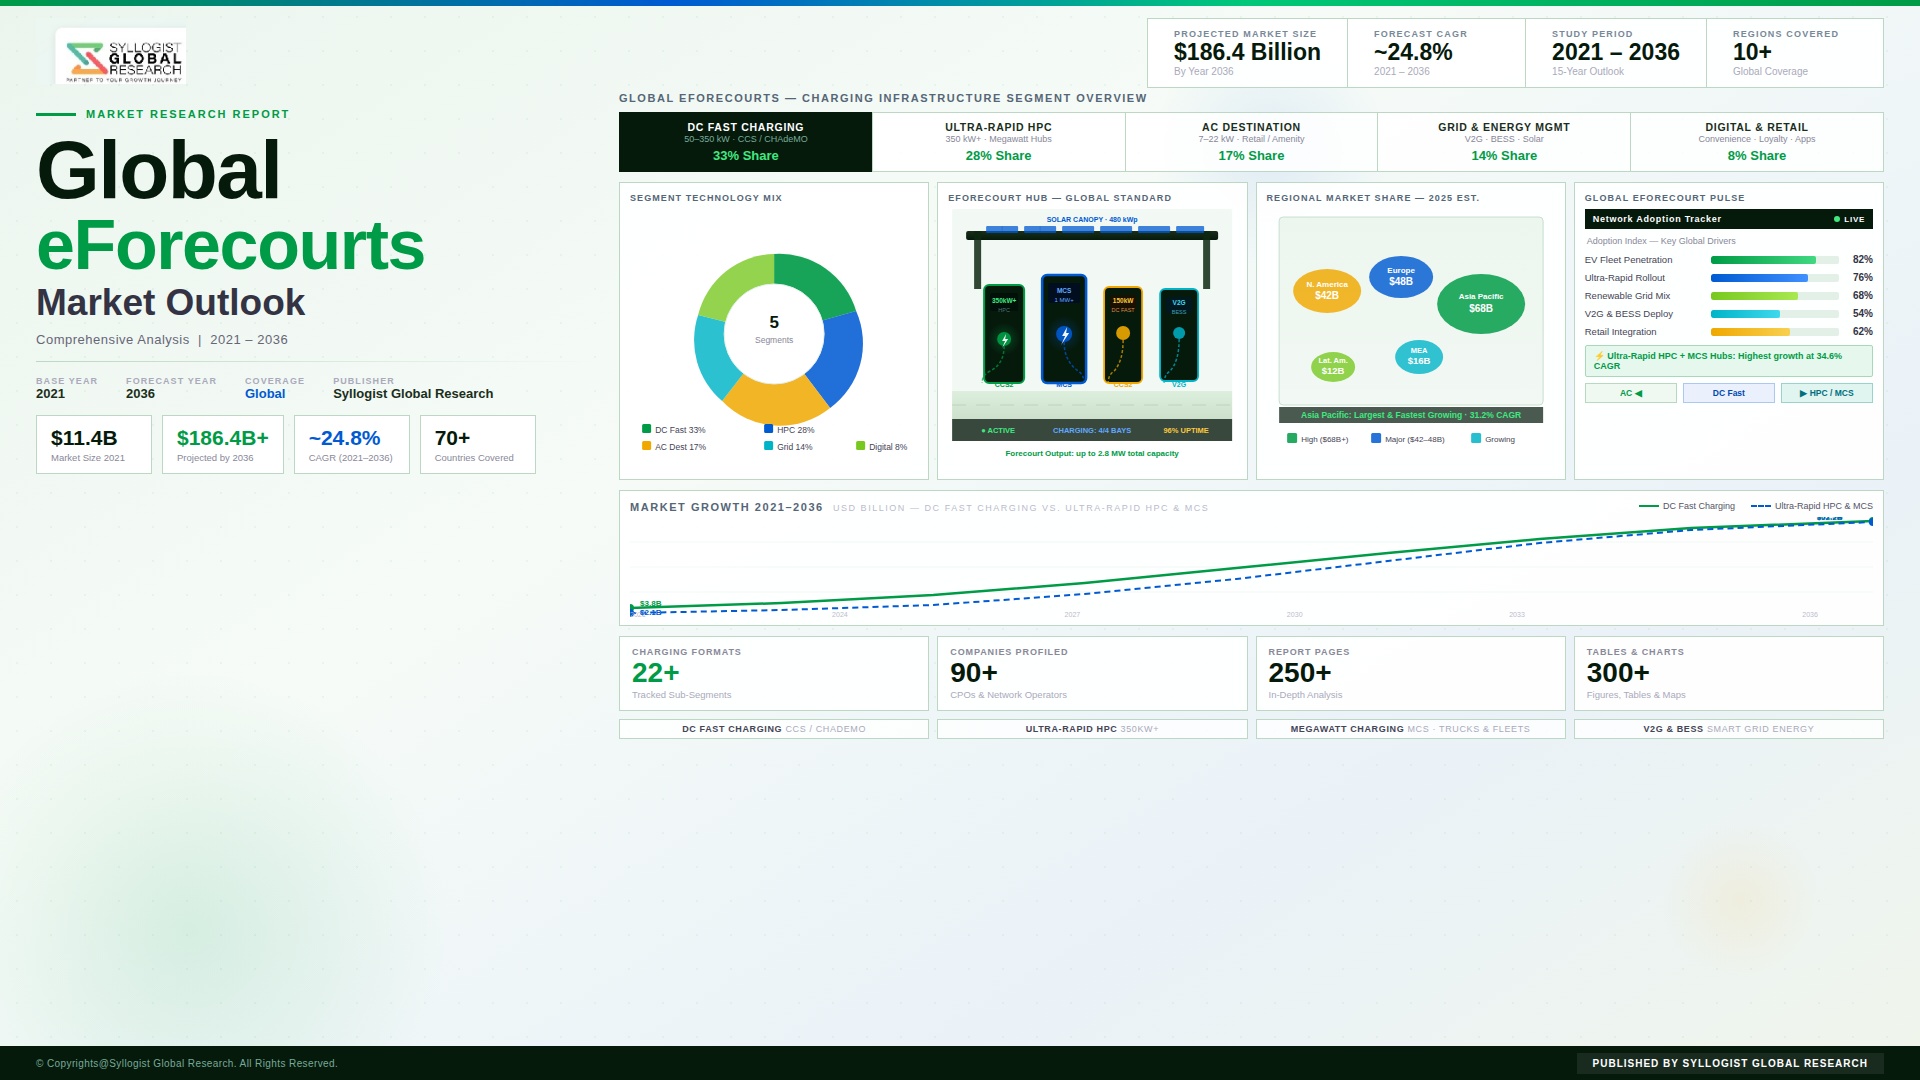
The global e-forecourts market is emerging as a structurally distinct and commercially critical segment of the worldwide electric vehicle charging infrastructure ecosystem, defined by its ambition to resolve the two most persistent and commercially consequential barriers to mainstream battery electric vehicle adoption across consumer and fleet operator segments in every major global market, specifically the charging speed inadequacy of legacy public charging infrastructure whose low power outputs require hours rather than minutes to meaningfully restore vehicle range, and the inferior site quality of first-generation public charging deployments that offered isolated charging posts without the convenience retail, food and beverage, and predictable service standards that conventional petroleum forecourt customers have been conditioned to expect across decades of petrol and diesel vehicle refuelling. The global e-forecourts market was valued at approximately USD 3.8 billion in 2025 and is projected to reach USD 27.6 billion by 2034, advancing at a compound annual growth rate of 24.7% over the forecast period from 2027 to 2034, driven by the accelerating battery electric vehicle fleet expansion across all major global markets, the binding infrastructure deployment obligations of the European Union Alternative Fuels Infrastructure Regulation, the United States Bipartisan Infrastructure Law National Electric Vehicle Infrastructure and Charging and Fueling Infrastructure programmes, and equivalent national charging infrastructure investment frameworks being implemented across China, Japan, South Korea, Australia, and other leading BEV adoption markets, collectively generating an unprecedented simultaneous global public and private investment pipeline in high-power charging hub infrastructure whose combined deployment scale has no precedent in the history of alternative fuel vehicle refuelling infrastructure development.
The commercial architecture of the e-forecourt business model is proving substantially more complex and capital-intensive than conventional public charging deployment, as the combination of high-power multi-bay charging infrastructure, grid connection upgrades capable of sustaining simultaneous megawatt-scale power draw across multiple active charging bays, on-site battery energy storage systems mitigating peak demand grid charges and providing resilience against grid supply interruptions, solar photovoltaic canopy installations generating partial on-site renewable electricity supply, and the full retail amenity fit-out required to justify consumer dwell time and generate ancillary non-charging revenue streams creates a total site development capital requirement ranging from approximately USD 2.8 million at entry-level six-bay highway corridor sites in lower-cost construction markets to USD 12 million or more at premium large-format urban and destination e-forecourts in high-cost real estate and construction cost geographies. The multi-stream revenue model distinguishing commercially mature e-forecourts from simpler public charging installations combines charging session revenue, determined by the spread between wholesale electricity procurement cost and retail tariff per kilowatt-hour at the utilisation rate achieved across the charging bay array, with retail concession income from food service and convenience operators, fleet subscription and corporate account charging revenue from commercial vehicle operators, advertising and digital media revenue from forecourt signage, and in the most advanced operational models grid services revenue from battery storage demand response and vehicle-to-grid programmes, with leading operators in established markets reporting that ancillary non-charging revenues contribute 28% to 42% of total site revenue at fully mature operational e-forecourts, fundamentally improving the financial returns of the hub model relative to charging-only infrastructure investment cases.
The competitive landscape across global e-forecourt markets reflects a convergence of participant categories from previously distinct industry sectors whose differing strategic motivations, asset bases, and capital structures are producing a market architecture in which no single operator type commands an insurmountable competitive advantage, creating a dynamic multi-competitor environment whose outcome will be shaped by the relative merits of real estate positioning, capital efficiency, energy procurement sophistication, retail partnership quality, and fleet account development capability across operator categories. Petroleum retail incumbents including BP, Shell, TotalEnergies, EG Group, Pilot Flying J, and national fuel retail operators across Europe and Asia-Pacific hold the most strategically positioned high-traffic site portfolios whose existing food service, restroom, and convenience infrastructure provides an immediately deployable e-forecourt amenity foundation, but whose legacy site layouts, grid connection limitations, and existing lease and planning frameworks constrain the pace and power specification of charging hub deployment relative to purpose-built greenfield e-forecourts. Dedicated e-forecourt specialist developers including Gridserve in the United Kingdom, Fastned in the Netherlands and Continental Europe, and Jio-bp in India are establishing high-quality purpose-built hub site benchmarks demonstrating the consumer experience and financial return potential of the integrated charging and amenity destination format, while automaker-affiliated charging networks including Tesla Supercharger, Ionity, and the joint venture networks established by Ford, GM, Rivian, and other OEMs are deploying high-power multi-bay charging infrastructure at highway corridor locations that compete directly with independent e-forecourt operators for the highest-value long-distance charging occasion.
From a regional perspective, Europe accounts for approximately 39.2% of global e-forecourt market revenue in 2025, driven by the most advanced BEV fleet penetration rates globally in Norway, the Netherlands, Sweden, and the United Kingdom, the binding deployment obligations of the EU Alternative Fuels Infrastructure Regulation creating confirmed investment pipeline along TEN-T corridor networks across all 27 member states, and the concentration of dedicated e-forecourt specialist developers and petroleum retail incumbent hub programmes that together constitute the world’s most commercially developed e-forecourt competitive market. North America represents approximately 31.6% of global revenue in 2025, anchored by the USD 7.5 billion NEVI Formula Programme and USD 2.5 billion CFI Grant Programme under the Bipartisan Infrastructure Law that are collectively catalysing private co-investment at three to five times the federal dollar deployed, and by the scale of petroleum retail and travel centre network conversion programmes at the highest-traffic interstate interchange locations operated by Pilot Flying J, TravelCenters of America, and Shell and BP branded networks. Asia-Pacific is the fastest-growing regional market, advancing at a compound annual growth rate of 28.4% through 2034, led by China’s massive BEV fleet of approximately 22 million vehicles in 2025 generating urban and highway corridor e-forecourt demand across the world’s largest single-country EV market, and by Japan, South Korea, and Australia where national EV policy frameworks and charging infrastructure investment programmes are accelerating high-power hub deployment along national highway networks and in major metropolitan retail and transport interchange catchments.
Key Drivers
Accelerating Global Battery Electric Vehicle Fleet Expansion Across All Major Markets Generating Sustainable High-Power Public Charging Demand Density That Validates E-Forecourt Hub Economics
The sustained acceleration of battery electric vehicle new vehicle sales across European, North American, Chinese, and Asia-Pacific markets is expanding the addressable charging demand base for e-forecourt operators at a pace that is progressively converting previously marginal hub site locations into commercially viable high-utilisation charging destinations, as cumulative BEV fleet additions in each successive year continuously increase the catchment vehicle population surrounding established and planned e-forecourt sites and incrementally raise the average daily charging session throughput achievable across hub bay arrays in locations where BEV fleet density is approaching and exceeding commercial viability thresholds. Global battery electric vehicle new vehicle sales reached approximately 17.1 million units in 2025, bringing the total global BEV fleet to approximately 62 million vehicles, and are projected to grow to over 45 million annual registrations by 2030 as OEM product portfolio electrification across all vehicle segments, tightening emissions regulations in Europe, China, and North America, and total cost of ownership parity between electric and internal combustion engine vehicles across an expanding range of segments accelerates consumer and fleet operator adoption at a pace that continuously validates e-forecourt hub investment decisions made two to four years in advance of the BEV fleet density thresholds required for commercial breakeven achievement. E-forecourt operators across multiple markets report that hub sites in high-traffic highway interchange and urban arterial locations with catchment BEV fleet densities above 14,000 to 18,000 electric vehicles within a 20-kilometre radius are generating charging bay utilisation rates above 25% to 30% on an annualised basis, approaching commercial breakeven on charging revenue alone before ancillary retail and fleet account revenues are incorporated, confirming the BEV fleet growth trajectory as the primary commercial validation mechanism for the global e-forecourt investment thesis.
Government Infrastructure Funding Programmes and Mandatory Charging Deployment Regulations Across Major Economies Creating Regulatory-Backed Investment Demand and Risk-Mitigation Frameworks for E-Forecourt Development
The concurrent introduction of binding minimum charging infrastructure deployment regulations and large-scale public funding programmes across the European Union, United States, China, United Kingdom, Japan, South Korea, Canada, and Australia is creating an unprecedented simultaneous multi-market investment catalyst for e-forecourt market development whose combined public funding commitment exceeds USD 60 billion globally and whose binding regulatory deployment timelines are translating policy ambition into confirmed infrastructure procurement pipelines that commercial e-forecourt operators and infrastructure investors can underwrite within project finance structures requiring demonstrated revenue visibility. The EU Alternative Fuels Infrastructure Regulation mandates charging pool deployments at maximum 60-kilometre intervals along TEN-T core network motorways scaling from 600-kilowatt combined capacity by 2025 to 1,400 kilowatts by 2030, the United States Bipartisan Infrastructure Law commits USD 7.5 billion through NEVI and USD 2.5 billion through CFI programmes, China’s national EV charging infrastructure plan targets 60 million public charge points by 2030, and Japan, South Korea, and Australia each operate national charging infrastructure grant and co-funding programmes whose combined effect across simultaneous global deployment is creating a regulatory-backed investment architecture with no precedent in the history of alternative fuel vehicle infrastructure development. The interaction between regulatory minimum deployment obligations, which establish a price floor for e-forecourt investment returns by guaranteeing minimum infrastructure density targets that independently drive BEV adoption and charging demand, and public co-funding mechanisms that reduce the risk-adjusted capital cost of e-forecourt development during the critical early utilisation ramp period, is creating a globally coordinated investment enablement environment whose cumulative effect is accelerating commercial e-forecourt network development substantially beyond the pace achievable through purely market-driven private investment alone.
Petroleum Retail Incumbent Network Transformation Programmes Globally Deploying Existing High-Traffic Real Estate Assets and Consumer Retail Infrastructure to Accelerate E-Forecourt Market Development at Scale
The strategic electrification transition programmes of major global petroleum retail networks represent the single largest committed capital deployment pipeline into the e-forecourt market, as BP, Shell, TotalEnergies, ExxonMobil, Pilot Flying J, EG Group, and national fuel retail operators across Asia-Pacific and the Middle East collectively possess the most strategically positioned high-traffic forecourt and travel centre site portfolios globally, whose existing food service, restroom, convenience retail, and grid connection infrastructure provides the e-forecourt amenity and operational foundation that purpose-built greenfield developers must invest incrementally to replicate, and whose consumer brand recognition and loyalty programme relationships provide an established customer acquisition platform that reduces e-forecourt hub ramp-up periods for converted incumbent sites relative to new entrant operator locations. Shell has committed to deploying 500,000 charge points globally by 2025 under its Shell Recharge programme, with a significant concentration in high-power hub formats at premium Shell forecourt locations across Europe and North America; BP has committed USD 1 billion to BP Pulse EV charging network expansion through 2030 with a focus on high-power hub development at its highest-traffic forecourt estate locations; and TotalEnergies is deploying high-power charging across its network of over 16,000 European service stations through its TotalEnergies Charge programme. The competitive urgency driving fuel retail incumbent e-forecourt investment is compounded by the recognition that petroleum forecourt sites generating the highest fuel volume revenues today are precisely the high-traffic highway interchange and arterial route locations that will generate the highest EV charging session volumes as global fleet electrification advances, creating a strategic asset defence and long-term customer relationship preservation imperative for e-forecourt conversion investment that extends well beyond near-term revenue optimisation across all major incumbent-operated petroleum retail networks globally.
Key Challenges
Grid Connection Capacity Constraints and Interconnection Lead Times Limiting E-Forecourt Deployment Velocity and Commercial Opening Timelines Across Priority Markets Globally
The most operationally consequential and commercially damaging challenge confronting e-forecourt developers across all major global markets is the severe and structurally entrenched mismatch between the electrical grid connection capacity required to power multi-bay high-power charging hubs, whose simultaneous peak demand can reach one to four megawatts at sites with six to sixteen 150-kilowatt to 350-kilowatt chargers operating concurrently, and the available distribution grid infrastructure at the high-traffic highway and forecourt locations where e-forecourt commercial viability is highest, with new high-power grid service connections at the required capacity levels carrying processing lead times of 18 to 48 months from application submission to service energisation across the United Kingdom, Germany, France, the United States, Australia, and other major e-forecourt deployment markets. Distribution network operators and electric utilities across multiple countries are managing interconnection application queues that have expanded sharply with the simultaneous arrival of large-scale renewable energy project connections, industrial electrification programmes, and EV charging infrastructure applications competing for the same engineering resource and grid reinforcement capital deployment capacity, creating a structural processing bottleneck that applies indiscriminately to e-forecourt developer applications regardless of their regulatory priority designation or public funding status. A 2024 assessment of e-forecourt projects under development across European and North American markets identified grid connection delays as the primary cause of site opening timeline extensions in over 60% of projects, with an average delay of 13 to 17 months between planning or permit approval and site energisation attributable to grid connection processes alone. On-site battery energy storage systems deployed as a grid dependency mitigation strategy add USD 350,000 to USD 1.1 million to total site capital requirements, partially offsetting their demand charge and resilience benefits within overall site investment return calculations.
E-Forecourt Site Utilisation Rate Dependency on Local BEV Fleet Density Creating Financially Vulnerable Early Deployment Phases Across Markets Yet to Reach Critical Charging Demand Mass
The commercial viability of individual e-forecourt sites globally is critically dependent on achieving minimum charging bay utilisation rates sufficient to generate charging session revenue covering the combined capital depreciation, grid standing charges, electricity procurement costs, operations and maintenance expenditure, and retail site operating costs constituting the full e-forecourt cost base, yet utilisation rates achievable at newly opened sites are structurally constrained by the BEV fleet density within the site catchment area at the time of opening, which across a substantial portion of global markets outside Norway, the Netherlands, parts of the United Kingdom and Germany, and coastal United States markets remains below the threshold required for commercially adequate charging throughput without extended investor capital support during the utilisation ramp period. Operator financial modelling consistently identifies a minimum catchment BEV fleet density of 12,000 to 18,000 battery electric vehicles within a 20-kilometre radius as the commercial viability threshold for a standard six to eight-bay high-power e-forecourt hub achieving charging revenue breakeven at market-average retail tariff levels, a density threshold met as of 2025 only within the higher-penetration urban and suburban catchments of the most advanced BEV adoption markets, leaving the majority of global geographies requiring two to six additional years of BEV fleet growth before e-forecourt sites can approach commercial self-sufficiency on charging revenue alone without ongoing public subsidy support. The geographic concentration of current commercial viability within a small number of advanced markets creates a two-speed global e-forecourt investment environment in which commercially self-sustaining hub investment is possible only in BEV-mature markets while subsidy-dependent deployment dominates elsewhere, introducing political risk exposure to e-forecourt business cases in markets where public funding continuity is subject to electoral cycle uncertainty.
Electricity Procurement Cost Volatility and Market-Specific Tariff Structure Complexity Compressing E-Forecourt Charging Margin Across Diverse Global Operating Environments
E-forecourt operators across global markets face structurally distinct but equally consequential electricity cost challenges whose specific form varies by national and regional electricity market structure but whose common effect is the compression of the gross margin earned on charging session revenue from which all site operating costs must be recovered, creating a margin risk exposure that is particularly acute during the early utilisation ramp period when charging session volumes are insufficient to absorb fixed electricity infrastructure costs across a large enough revenue base to sustain positive operating contribution. In the United States, commercial electricity tariffs across the majority of utility jurisdictions impose demand charges based on peak power draw during the highest 15-minute or 30-minute consumption interval within each billing period, generating monthly demand charge liabilities of USD 10,800 to USD 21,600 at six-bay 900-kilowatt peak hubs even at low average utilisation, with demand charges representing 40% to 65% of total electricity procurement expenditure at low to moderate utilisation sites. In Europe, wholesale electricity market price volatility between 2021 and 2024 saw day-ahead prices in Germany, France, and the United Kingdom at various points exceeding USD 500 per megawatt-hour against long-run averages below USD 80 per megawatt-hour, creating periods of deeply negative charging margin for operators procuring on short-term market terms. In Asia-Pacific markets, regulated commercial electricity tariff structures, import dependency on liquefied natural gas for grid generation, and seasonal demand variability each create distinct electricity cost risk profiles for e-forecourt operators. Long-term renewable power purchase agreements, on-site solar and storage integration, and demand response programme participation represent the primary mitigation strategies, each requiring upfront capital commitments and contract tenure commitments that introduce their own risk dimensions into e-forecourt project finance structures.
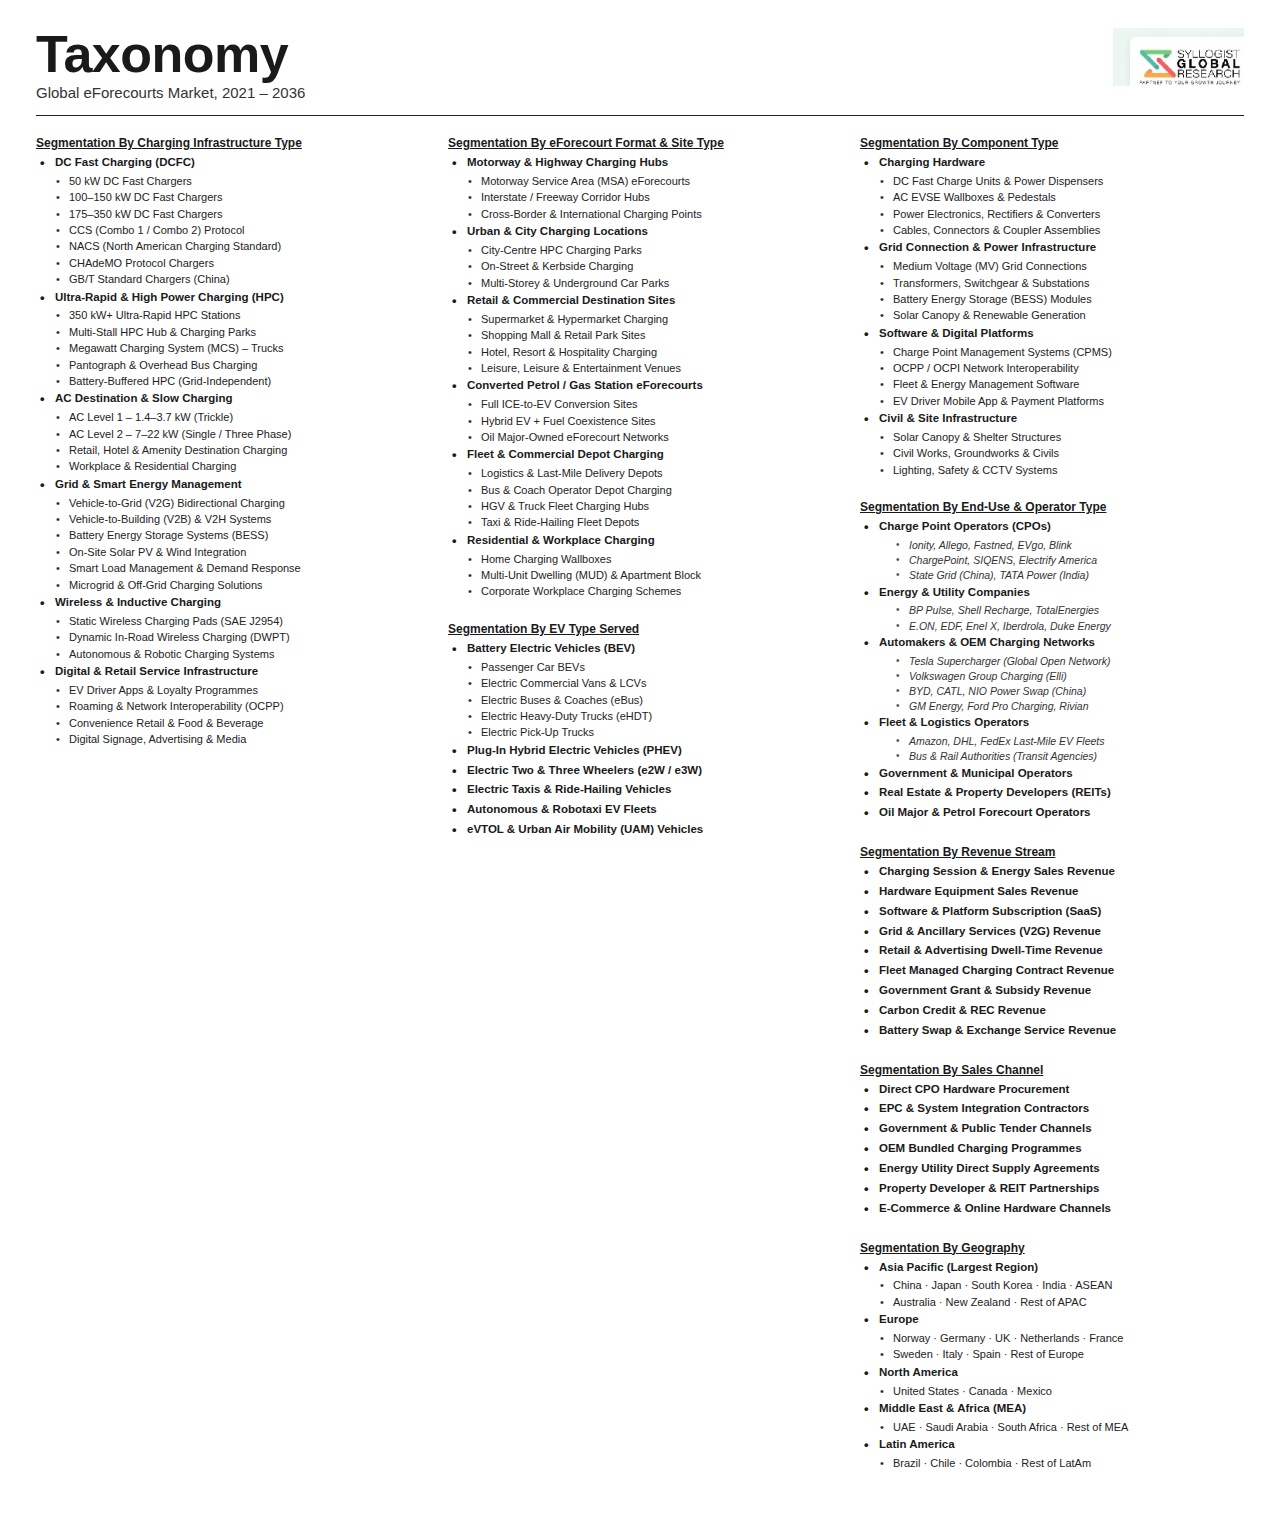
Market Segmentation
- Segmentation By Charging Power Level
- High-Power DC Fast Charging (150 kW to 249 kW)
- Ultra-High-Power DC Fast Charging (250 kW to 349 kW)
- Megawatt-Class DC Fast Charging (350 kW and Above)
- Mixed-Power Hub (Combination of AC Level 2 and DC Fast Charging)
- Others
- Segmentation By Site Type
- Motorway and Highway Interchange Corridor E-Forecourt Hubs
- Urban and Suburban Arterial Route E-Forecourts
- Retail Park and Leisure Destination E-Forecourts
- Travel Centre and Truck Stop E-Forecourt Conversions
- Converted Incumbent Petroleum Retail Forecourt Sites
- Purpose-Built Greenfield E-Forecourt Developments
- Airport and Transport Interchange E-Forecourts
- Others
- Segmentation By Number of Charging Bays
- Small Hub Format (2 to 5 Simultaneous Charging Bays)
- Medium Hub Format (6 to 12 Simultaneous Charging Bays)
- Large Hub Format (13 to 24 Simultaneous Charging Bays)
- Mega Hub Format (25 and Above Simultaneous Charging Bays)
- Others
- Segmentation By Operator Type
- Dedicated E-Forecourt Specialist Developers and Operators
- Incumbent Petroleum Retail and Travel Centre Network Operators
- National and Pan-Regional EV Charging Network Operators
- Electric Utility and Energy Company-Operated Hubs
- Automaker-Affiliated Charging Network Operators
- Real Estate Developer and Commercial Property-Led Operators
- Public Sector and Municipally Operated Charging Hubs
- Others
- Segmentation By Energy Source
- Grid-Supplied Utility Power With Renewable Energy Certificates
- On-Site Solar Photovoltaic Generation With Grid Backup
- Battery Energy Storage System Integrated Supply
- Combined Solar, Storage, and Grid Hybrid Supply
- Long-Term Wind and Solar Power Purchase Agreement Backed Supply
- Green Tariff and Community Choice Aggregation Backed Supply
- Others
- Segmentation By Ancillary Service Offering
- Convenience Retail and Grocery
- Quick Service Restaurant and Coffee Concessions
- Full-Service and Casual Dining
- Vehicle Wash and Detailing Services
- Restroom and Traveller Amenity Facilities
- Wi-Fi Connectivity and Digital Lounge Amenities
- Fleet Management and Commercial Vehicle Services
- Advertising and Digital Out-of-Home Media
- Loyalty Programme and Rewards Platform Integration
- Others
- Segmentation By Revenue Model
- Pay-As-You-Go Per-kWh Retail Tariff Charging
- Fleet and Corporate Subscription Account Charging
- Roaming and Network Interoperability Partner Revenue
- Retail Concession and Tenancy Income
- Grid Services and Demand Response Revenue
- Battery Storage Energy Arbitrage Revenue
- Advertising and Sponsorship Revenue
- Public Co-Funding and Infrastructure Grant Revenue
- Others
- Segmentation By Vehicle Type Served
- Passenger Battery Electric Vehicles
- Plug-In Hybrid Electric Vehicles
- Light Commercial Electric Vans and Delivery Vehicles
- Medium and Heavy Electric Commercial Trucks
- Electric Pickup Trucks and SUVs
- Electric Buses and Coaches
- Others
- Segmentation By Region
- North America
- Europe
- Asia-Pacific
- Middle East and Africa
- Latin America
All market revenues are presented in USD
Historical Year: 2021-2024 | Base Year: 2025 | Estimated Year: 2026 | Forecast Period: 2027-2034
Key Questions this Study Will Answer
- What is the total global e-forecourts market valuation in the base year 2025, and what is the projected market size and compound annual growth rate through 2034, disaggregated by charging power level across high-power DC fast, ultra-high-power DC fast, and megawatt-class charging categories, by site type across highway corridor hubs, urban and suburban arterial e-forecourts, travel centre conversions, retail destination sites, and purpose-built greenfield developments, and by region across Europe, North America, Asia-Pacific, Middle East and Africa, and Latin America, to enable e-forecourt developers, charging network operators, petroleum retail incumbents, electric utilities, infrastructure investors, and charging equipment manufacturers to identify which site formats, power configurations, and geographic markets will generate the highest absolute revenue growth and the most commercially validated hub economics across the forecast period as global BEV fleet penetration accelerates toward critical mass charging demand density thresholds in successive regional markets?
- How are the binding mandatory charging infrastructure deployment obligations of the European Union Alternative Fuels Infrastructure Regulation, the United States Bipartisan Infrastructure Law NEVI and CFI programmes, China’s national EV charging infrastructure plan, and equivalent national frameworks in Japan, South Korea, Canada, Australia, and the United Kingdom collectively translating into confirmed e-forecourt development pipeline volumes by country, corridor type, and operator category, and what is the projected split of regulatory and publicly funded infrastructure deployment between petroleum retail incumbent network upgrades, dedicated e-forecourt specialist developer sites, charging network operator hub programmes, and automaker-affiliated charging infrastructure investments at what per-site capital cost and charging bay count configurations, providing the investment pipeline visibility required to calibrate equipment supply capacity, utility interconnection planning, and infrastructure capital allocation across the simultaneous multi-market deployment surge anticipated through 2030?
- What are the detailed unit economics of a commercially representative global e-forecourt hub across different regional market contexts at 2025 operational benchmarks and projected 2030 maturity benchmarks, including total site development capital cost per charging bay by site type, power level, and geographic region, average charging bay utilisation rate by market maturity tier and site location category, charging session gross margin per kilowatt-hour delivered at market-average retail tariff levels net of electricity procurement costs, ancillary retail and fleet account revenue contribution as a percentage of total site revenue at operational maturity, and the minimum BEV fleet catchment density within a defined radius required to achieve site-level charging revenue breakeven for each hub format, providing a cross-regional commercial viability framework that distinguishes high-viability metropolitan and major highway corridor locations from rural and low-BEV-density corridor segments requiring sustained public funding support across different global market deployment contexts?
- How are grid connection capacity constraints and interconnection lead times of 18 to 48 months across major global markets, electricity demand charge tariff structures in United States utility jurisdictions, wholesale electricity price volatility in European markets, and regulated commercial electricity tariff complexity in Asia-Pacific markets affecting e-forecourt development pipeline execution rates, site financial return profiles, and operator investment strategies globally, and what are the specific technical and commercial mitigation strategies being deployed by leading e-forecourt operators across on-site battery energy storage integration, long-term renewable power purchase agreement procurement, solar photovoltaic canopy generation, demand response programme participation, and utility partnership frameworks for expedited grid connection processing that are reducing electricity cost exposure and grid dependency risk at operational hub sites, at what quantified capital investment requirement and what measurable reduction in effective electricity cost per kilowatt-hour delivered providing reference benchmarks for global e-forecourt site design and energy procurement strategy?
- Who are the leading e-forecourt developers and operators, incumbent petroleum retail and travel centre network operators executing large-scale electrification conversion programmes, automaker-affiliated and independent EV charging network operators deploying high-power hub formats, electric utility-backed infrastructure investors, and charging equipment manufacturers currently defining the competitive landscape of the global e-forecourts market, and what are their respective operational site portfolio sizes and confirmed development pipeline commitments by region and site format, capital investment programmes and funding structures across equity, project finance, public co-funding, and tax incentive utilisation, charging equipment technology platform selections and preferred supplier relationships, retail and food service concession partnership models generating ancillary revenue at hub sites, renewable energy procurement and on-site generation strategies managing electricity cost and sustainability credentialing, and strategic competitive positioning relative to each other and to the BEV fleet growth trajectory and regulatory deployment timeline that together define the pace and geographic distribution of commercial e-forecourt market development across all major global regions through 2034?
- Product Definition
- Research Methodology
- Research Design & Framework
- Overall Research Approach: Descriptive, Exploratory & Quantitative Mixed-Method Design
- Market Definition & Scope Boundaries: What is Included and Excluded
- Segmentation Framework
- Key Research Assumptions & Limitations
- Secondary Research
- Primary Research Design & Execution
- Data Triangulation & Validation
- Market Sizing & Forecasting Methodology
- Competitive Intelligence Methodology
- Quality Assurance & Peer Review
- Definitions, Abbreviations & Data Notes
- Research Design & Framework
- Executive Summary
- Market Snapshot & Headline Numbers
- Key Findings & Research Highlights
- Market Dynamics
- Regional Market Summary
- Competitive Landscape Snapshot
- Technology & Innovation Highlights
- Market Dynamics
- Drivers
- Restraints
- Opportunities
- Challenges
- Porter’s Five Forces Analysis
- PESTLE Analysis
- Market Trends & Developments
- Emerging Trends
- Technological Developments
- Regulatory & Policy Changes
- Supply Chain & Sourcing Trends
- Manufacturing & Process Trends
- Investment & Funding Activity
- Sustainability & ESG Trends
- Risk Assessment Framework
- Grid Capacity, Power Infrastructure Upgrade Cost & Electricity Network Constraint Risk
- EV Adoption Rate Uncertainty, Charging Demand Forecasting & Utilisation Risk
- Cybersecurity, Payment System Fraud & Connected Charging Infrastructure Vulnerability Risk
- Real Estate Availability, Planning Permission, Land Cost & Site Development Risk
- Technology Obsolescence, Charging Standard Fragmentation & Stranded Asset Risk
- Regulatory Framework & Standards
- EV Charging Infrastructure Mandates, National Rollout Targets & Public Funding Frameworks
- Interoperability & Roaming Standards: OCPP, OCPI, ISO 15118 & Plug & Charge Protocol Requirements
- Building Regulations, Planning & Permitted Development Rights for e-Forecourt Site Development
- Electricity Retail Licensing, Tariff Regulation & Smart Charging Grid Balancing Policy Frameworks
- Payment Services, Consumer Protection, Accessibility & Pricing Transparency Regulations for EV Charging
- Global e-Forecourts Market Outlook
- Market Size & Forecast by Value
- Market Size & Forecast by Volume (Number of Sites, Charging Points & Sessions)
- Market Size & Forecast by Infrastructure Component
- DC Fast Charging Equipment: 50 kW to 150 kW Rapid Chargers & Associated Switchgear
- Ultra-Rapid & High-Power Charging (HPC) Equipment: 150 kW to 350 kW+ Dispensers
- AC Destination Charging Infrastructure: 7 kW to 22 kW Chargers for Dwell-Time Locations
- Grid Connection & Electrical Infrastructure: Transformers, Switchboards & Cable Ducting
- Battery Energy Storage Systems (BESS) for Peak Shaving, Grid Stability & Demand Management
- On-Site Renewable Energy Generation: Solar PV Canopies, Wind Integration & Microgrid Systems
- Digital Infrastructure: Payment Terminals, CPMS Software, Network Connectivity & Back-Office Platform
- Canopy, Forecourt Civil Works, Lighting, Signage & Customer Amenity Infrastructure
- Market Size & Forecast by Technology
- Combined Charging System (CCS): CCS1 & CCS2 Standard DC Fast & Ultra-Rapid Charging Technology
- CHAdeMO Protocol Charging Technology
- Tesla NACS (North American Charging Standard) & Supercharger Network Technology
- AC Type 2 (Mennekes) & J1772 Destination Charging Technology
- ISO 15118 Plug & Charge (PnC) & Vehicle-to-Grid (V2G) Bidirectional Charging Technology
- Dynamic Load Management, Smart Charging & Demand Response Technology
- Battery Energy Storage Integration & On-Site Renewable Energy Coupling Technology
- AI-Enabled Site Optimisation, Predictive Maintenance & Customer Analytics Technology
- Market Size & Forecast by Charging Speed
- Rapid Charging (50 kW to 149 kW)
- Ultra-Rapid Charging (150 kW to 349 kW)
- High-Power Charging (350 kW and Above)
- Destination & AC Charging (Up to 22 kW)
- Market Size & Forecast by Site Format
- Purpose-Built Standalone e-Forecourt: Large-Format EV-Only Charging Hub
- Converted Petrol Forecourt: Legacy Fuel Retail Site Retrofitted with EV Charging Infrastructure
- Motorway Service Area & Highway Corridor Charging Hub
- Retail, Supermarket & Shopping Centre Integrated Charging Forecourt
- Hotel, Hospitality & Leisure Venue Integrated Charging Forecourt
- Fleet Depot, Logistics Hub & Commercial Vehicle Charging Forecourt
- Urban & City Centre Fast Charging Hub
- Market Size & Forecast by Application
- Passenger Car Public Charging
- Light Commercial Vehicle (LCV) & Last-Mile Delivery Fleet Charging
- Heavy Commercial Vehicle (HCV), Bus & Coach High-Power Charging
- Ride-Hailing, Taxi Fleet & Shared Mobility Operator Charging
- Hydrogen Fuel Cell Vehicle (FCEV) Dispensing at Integrated e-Forecourt Sites
- Market Size & Forecast by End-User
- Private EV Drivers & Consumer Retail Charging Customers
- Fleet Operators & Corporate Mobility Managers
- Fuel Retail & Forecourt Operators
- Motorway Service Area & Highway Operators
- Real Estate Developers, Retail Parks & Hospitality Groups
- Municipalities, Local Authorities & Public Infrastructure Bodies
- Market Size & Forecast by Revenue Model
- Pay-As-You-Go: Per kWh, Per Minute & Per Session Pricing
- Subscription & Membership Model: Monthly & Annual Roaming Pass
- White-Label & Franchise Network Licensing Model
- Ancillary Revenue: Retail, Food & Beverage, Advertising & Loyalty Programme
- Vehicle-to-Grid (V2G) & Grid Services Revenue: Frequency Response & Demand Turn-Down
- North America e-Forecourts Market Outlook
- Market Size & Forecast
- By Value
- By Volume (Number of Sites, Charging Points & Sessions)
- By Infrastructure Component
- By Technology
- By Charging Speed
- By Site Format
- By Application
- By End-User
- By Country
- By Revenue Model
- Market Size & Forecast
- Europe e-Forecourts Market Outlook
- Market Size & Forecast
- By Value
- By Volume (Number of Sites, Charging Points & Sessions)
- By Infrastructure Component
- By Technology
- By Charging Speed
- By Site Format
- By Application
- By End-User
- By Country
- By Revenue Model
- Market Size & Forecast
- Asia-Pacific e-Forecourts Market Outlook
- Market Size & Forecast
- By Value
- By Volume (Number of Sites, Charging Points & Sessions)
- By Infrastructure Component
- By Technology
- By Charging Speed
- By Site Format
- By Application
- By End-User
- By Country
- By Revenue Model
- Market Size & Forecast
- Latin America e-Forecourts Market Outlook
- Market Size & Forecast
- By Value
- By Volume (Number of Sites, Charging Points & Sessions)
- By Infrastructure Component
- By Technology
- By Charging Speed
- By Site Format
- By Application
- By End-User
- By Country
- By Revenue Model
- Market Size & Forecast
- Middle East & Africa e-Forecourts Market Outlook
- Market Size & Forecast
- By Value
- By Volume (Number of Sites, Charging Points & Sessions)
- By Infrastructure Component
- By Technology
- By Charging Speed
- By Site Format
- By Application
- By End-User
- By Country
- By Revenue Model
- Market Size & Forecast
- Country-Wise* e-Forecourts Market Outlook
- Market Size & Forecast
- By Value
- By Volume (Number of Sites, Charging Points & Sessions)
- By Infrastructure Component
- By Technology
- By Charging Speed
- By Site Format
- By Application
- By End-User
- By Country
- By Revenue Model
- Market Size & Forecast
- *Countries Analyzed in the Syllogist Global Research Portfolio: United States, Canada, Mexico, Germany, France, United Kingdom, Netherlands, Spain, Italy, Norway, Sweden, China, Japan, India, Australia, South Korea, Singapore, Brazil, Chile, Saudi Arabia, UAE, Egypt, South Africa, Israel
- Technology Landscape & Innovation Analysis
- Ultra-Rapid & High-Power Charging (HPC) Hardware: 350 kW+ Dispenser & Liquid-Cooled Cable Technology Deep-Dive
- ISO 15118 Plug & Charge, Vehicle-to-Grid (V2G) & Bidirectional Energy Flow Technology
- On-Site Battery Energy Storage (BESS) Integration: Peak Shaving, Grid Arbitrage & Backup Power Technology
- Solar PV Canopy, On-Site Renewable Generation & Microgrid Control Technology for e-Forecourts
- Dynamic Load Management, Smart Charging Optimisation & Demand Response Technology
- AI-Enabled Site Operations: Predictive Maintenance, Utilisation Forecasting & Customer Experience Personalisation
- Payment, Roaming & CPMS Platform Technology: OCPP 2.0.1, OCPI & Open Standards Back-Office Integration
- Patent & IP Landscape in e-Forecourt & EV Charging Infrastructure Technologies
- Value Chain & Supply Chain Analysis
- Charging Equipment OEM & Power Electronics Component Supply Chain
- Battery Energy Storage System & On-Site Renewable Energy Equipment Supply Chain
- Grid Connection, Transformer, Switchgear & Electrical Balance-of-Plant Supply Chain
- Civil Engineering, Canopy Construction & Forecourt Fitout Supply Chain
- CPMS Software, Payment Platform & Network Connectivity Supply Chain
- CPO, Site Developer, Fuel Retailer & Real Estate Partner Channel
- Operations, Maintenance, Remote Monitoring & Asset Management Service Channel
- Pricing Analysis
- DC Fast & Ultra-Rapid Charger Hardware Unit Cost & Total Site Capital Expenditure Analysis
- Grid Connection Upgrade & Electrical Infrastructure Cost Analysis by Site Scale
- BESS & On-Site Solar PV Integration Capital Cost & Payback Period Analysis
- Per kWh, Per Minute & Session-Based Consumer Pricing Benchmarking Across Key Markets
- CPO Revenue, Operating Cost & Site-Level EBITDA Economics Analysis
- Total e-Forecourt Development Economics: CapEx, OpEx, Revenue & Return on Investment Modelling
- Sustainability & Environmental Analysis
- Lifecycle Assessment (LCA) of e-Forecourt Infrastructure: Embodied Carbon, Operational Energy & End-of-Life
- Renewable Energy Sourcing, Green Tariff Procurement & Carbon-Neutral Charging Site Certification
- BESS Second-Life Battery Integration: Repurposed EV Battery Use & Environmental Benefit Assessment
- EV Charging vs. Petrol Forecourt: Well-to-Wheel Carbon Savings & Air Quality Improvement Contribution
- ESG Reporting, Net Zero Commitments & Sustainable Site Design Standards for e-Forecourt Operators
- Competitive Landscape
- Market Structure & Concentration
- Market Consolidation Level (Fragmented vs. Consolidated by Site Format & Geography)
- Top 10 Players Market Share
- HHI (Herfindahl-Hirschman Index) Concentration Analysis
- Competitive Intensity Map by Site Format, Charging Speed & Geography
- Player Classification
- Pure-Play Charge Point Operators (CPOs) & e-Forecourt Network Developers
- Legacy Fuel Retail Groups Transitioning to e-Forecourt Operators
- Motorway Service Area & Highway Charging Network Operators
- Utility & Energy Company-Backed Charging Infrastructure Developers
- Charging Equipment OEMs with Network & CPO Capabilities
- Real Estate, Retail & Hospitality Groups Integrating e-Forecourt Infrastructure
- Technology & Software Platform Providers: CPMS, Roaming & Smart Charging Solutions
- Start-ups & New Entrants in High-Power Charging Hub Development
- Competitive Analysis Frameworks
- Market Share Analysis by Site Format, Technology & Region
- Company Profile
- Company Overview & Headquarters
- e-Forecourt Network Size, Site Portfolio & Charging Point Count
- Key Customer Relationships, Site Partnerships & Real Estate Network
- Geographic Footprint & Expansion Pipeline
- Revenue (e-Forecourt & Charging Segment) & Utilisation Rates
- Technology Differentiators & IP
- Key Strategic Partnerships, JVs & M&A Activity
- Recent Developments (Site Openings, Network Expansions, Technology Upgrades)
- SWOT Analysis
- Strategic Focus Areas & Roadmap
- Competitive Positioning Map (Network Scale vs. Charging Speed Capability)
- Key Company Profiles
- Market Structure & Concentration
- Strategic Opportunity Analysis
- Strategic Output
- Market Opportunity Matrix: By Infrastructure Component, Site Format, Application, End-User & Geography
- White Space Opportunity Analysis
- Strategic Recommendations
- Product Portfolio & Technology Investment Strategy
- Site Development & Operational Excellence Strategy
- Geographic Expansion & Localisation Strategy
- Customer & End-User Engagement Strategy
- Partnership, M&A & Ecosystem Strategy
- Sustainability & Circular Economy Strategy
- Risk Mitigation & Future Roadmap
- Strategic Priority Matrix & Roadmap
- Near-term (2025-2028)
- Mid-term (2029-2032)
- Long-term (2033-2037)
- Strategic Output