Market Definition
The North America e-Forecourts Market encompasses the development, ownership, operation, and commercial management of dedicated electric vehicle charging hubs that are purpose-built or comprehensively retrofitted to replicate and enhance the throughput capacity, service convenience, and multi-revenue amenity experience of conventional gasoline forecourts within a fully electrified refuelling infrastructure context, serving battery electric vehicle and plug-in hybrid electric vehicle drivers requiring high-power public charging across interstate highway corridors, state and provincial arterial routes, urban and suburban retail destination catchments, and commercial fleet depot environments throughout the United States, Canada, and Mexico. An e-forecourt in the North American context is defined by its integration of multiple simultaneous high-power direct current fast charging bays operating at output capacities of 150 kilowatts to 350 kilowatts or greater per charger, accommodating six or more vehicles concurrently, within a purpose-designed site that combines charging infrastructure with complementary amenity and retail services including convenience retail, quick service restaurant concessions, restrooms, loyalty programme integration, and vehicle services that generate ancillary non-charging revenue streams and justify extended customer dwell time beyond the duration of the charging session. The market encompasses the complete value chain of e-forecourt development and operation, including site identification, land acquisition and lease structuring, utility grid interconnection engineering, charging equipment procurement and installation, canopy and civil infrastructure construction, retail amenity fit-out, digital payment and energy management platform deployment, renewable energy integration through on-site solar generation and battery storage systems, ongoing operations and maintenance, and the multi-party commercial structures linking charging network operators, energy retailers, real estate developers, fuel retail incumbents transitioning their forecourt estates, and independent e-forecourt specialist developers. Key participants include dedicated e-forecourt developers and operators, incumbent petroleum retail networks executing electrification transition strategies, charging equipment manufacturers, electric utilities and renewable power suppliers, quick service restaurant and convenience retail brands, fleet telematics and commercial account service providers, and federal and state regulatory bodies whose alternative fuels infrastructure programme frameworks and funding mechanisms govern incentive allocation for public charging infrastructure deployment across North American road networks.
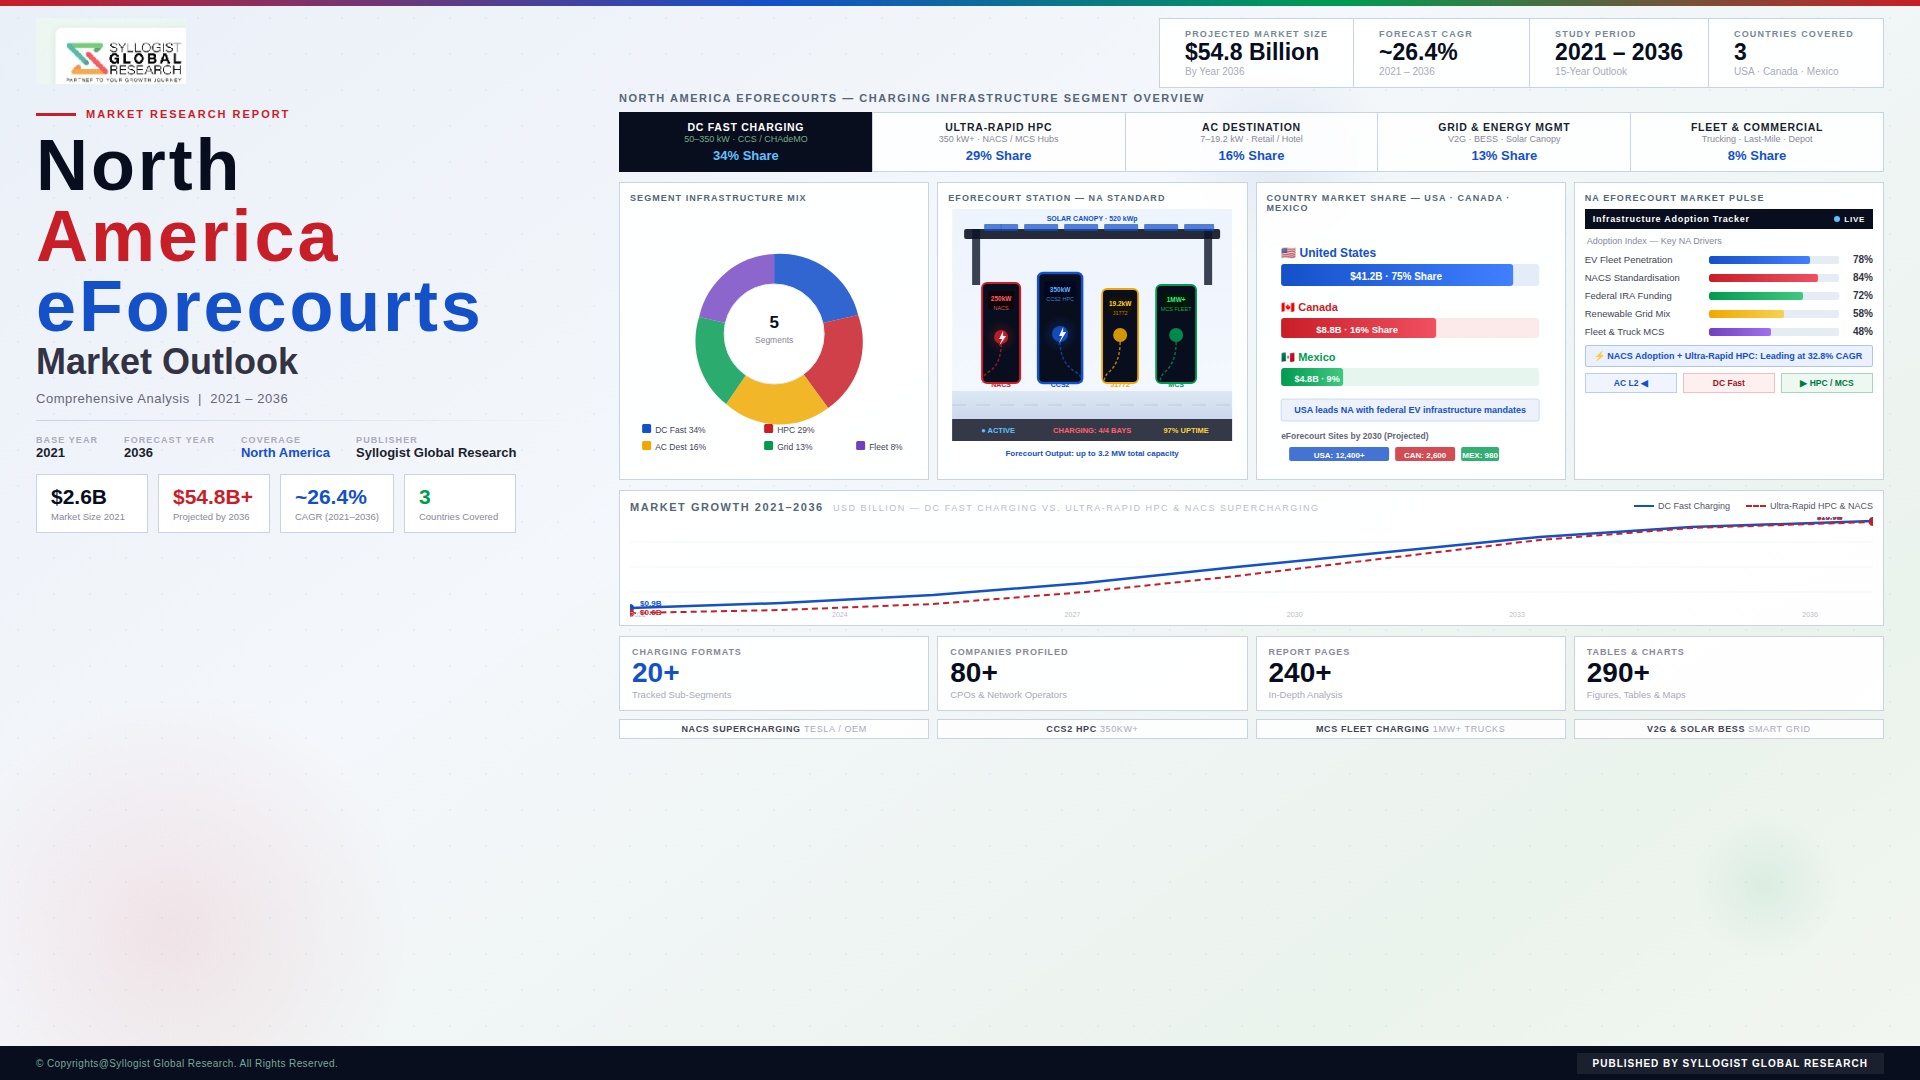
Market Insights
The North America e-forecourts market is emerging from an early-stage public charging deployment phase characterised by isolated charging posts and low-amenity installations toward a mature high-power hub model that addresses the two most commercially critical barriers to mainstream battery electric vehicle adoption across the uniquely challenging North American geography, namely the inadequacy of low-power charging infrastructure to serve the long-distance interstate highway driving patterns that define personal vehicle usage for a significant share of the United States and Canadian driving population, and the deeply entrenched consumer expectation of the full-service gasoline station experience, including rapid refuelling, convenience retail, and food and beverage access, that shapes the benchmark against which public charging site quality is evaluated by drivers accustomed to the service standards of mature petroleum forecourt networks. The North America e-forecourts market was valued at approximately USD 1.2 billion in 2025 and is projected to reach USD 8.6 billion by 2034, advancing at a compound annual growth rate of 24.5% over the forecast period from 2027 to 2034, driven by the accelerating battery electric vehicle fleet expansion across United States, Canadian, and Mexican markets, the federal and state funding programmes supporting public charging infrastructure deployment through the National Electric Vehicle Infrastructure Formula Programme and Charging and Fueling Infrastructure Grant Programme, and the growing commercial validation of the multi-service e-forecourt business model by first-mover operators whose operational hub sites are demonstrating ancillary revenue generation potential that substantially improves overall site financial returns beyond what charging session revenue alone could support.
The United States federal investment in public charging infrastructure through the Bipartisan Infrastructure Law represents the most consequential single policy catalyst for e-forecourt market development in North American history, with the USD 7.5 billion National Electric Vehicle Infrastructure programme allocating formula funding to all fifty states and the District of Columbia for alternative fuel corridor charging infrastructure deployment along the Interstate Highway System and designated alternative fuel corridors, and the USD 2.5 billion Charging and Fueling Infrastructure Grant Programme providing competitive grant funding for community and fleet charging installations that together are creating a public investment framework attracting private co-investment multiples of three to five dollars of private capital for every dollar of federal grant funding deployed. The NEVI Formula Programme requires participating states to install charging stations meeting minimum specifications of four 150-kilowatt direct current fast chargers per station at maximum 50-mile intervals along designated corridors, technical and site quality specifications that align closely with the entry-level e-forecourt hub format and that are driving state departments of transportation to issue competitive procurement solicitations attracting bids from dedicated e-forecourt developers, charging network operators, and fuel retail incumbents whose combined bid submissions are revealing the depth of private sector interest in the federally catalysed e-forecourt site development opportunity. The interaction between NEVI corridor funding and state-level additional investment programmes, with California, New York, Texas, Florida, and Washington each operating supplementary charging infrastructure grant and incentive programmes that extend public support beyond NEVI-designated corridors into urban, rural, and underserved community locations, is creating a layered public investment architecture whose combined deployment is expected to catalyse total e-forecourt network infrastructure investment of approximately USD 38 billion across the United States through 2030.
The competitive landscape of the North American e-forecourts market is characterised by a distinctly different participant mix relative to the European market, reflecting the greater geographic scale of North American road networks, the higher average vehicle miles travelled per driver, the stronger cultural association between the gasoline station and the broader travel convenience centre format, and the more advanced state of proprietary automaker-aligned charging network development led by Tesla’s Supercharger network, whose 50,000-plus global charger estate and vertical integration of vehicle, charging hardware, and network software has established the operational and consumer experience reference standard against which all competing e-forecourt operators are evaluated by North American battery electric vehicle drivers. Charge point network operators including EVgo, Blink Charging, ChargePoint, and Electrify America are developing high-power hub formats at retail, grocery, and motorway rest area locations that incorporate food and beverage partnerships, loyalty integration, and improved site quality to compete with the Tesla Supercharger experience, while petroleum retail incumbents including Shell, BP, EG Group, and Pilot Flying J, whose truck stop and travel centre network represents the most strategically positioned real estate portfolio for interstate highway e-forecourt deployment in North America, are accelerating high-power charging hub installations at their highest-traffic travel centre locations where existing food service, restroom, and convenience retail infrastructure can be immediately leveraged to provide the full-service e-forecourt experience without incremental retail amenity capital investment.
From a country-level perspective, the United States accounts for approximately 82.4% of total North American e-forecourt market revenue in 2025, driven by its 4.2 million battery electric vehicle fleet, the most developed state-level EV policy infrastructure globally outside Norway, and the scale of federally committed charging infrastructure investment that is catalysing private sector e-forecourt development at a pace and geographic breadth unmatched elsewhere in the region. Canada represents the second-largest national market, with approximately 11.4% of regional revenue in 2025, supported by a federal zero emission vehicle infrastructure programme and provincial incentive frameworks in British Columbia, Quebec, and Ontario that are driving e-forecourt hub development along Trans-Canada Highway corridors and in major metropolitan areas where battery electric vehicle fleet density is approaching commercial viability thresholds for high-power hub operation. Mexico is the emerging third market, accounting for approximately 6.2% of regional revenue in 2025 but advancing at the highest country-level growth rate within the region as growing battery electric vehicle adoption among upper-income consumer segments in Mexico City, Monterrey, and Guadalajara is generating urban arterial route e-forecourt demand, and as nearshoring-driven industrial growth in northern border states creates commercial electric fleet charging requirements at logistics corridor locations that are beginning to attract dedicated e-forecourt developer investment supported by bilateral United States-Mexico infrastructure connectivity programme funding under the North American EV supply chain investment framework.
Key Drivers
Federal Bipartisan Infrastructure Law Funding Programmes Creating Unprecedented Public Investment Catalyst for Highway Corridor and Community E-Forecourt Hub Deployment
The USD 7.5 billion National Electric Vehicle Infrastructure Formula Programme and USD 2.5 billion Charging and Fueling Infrastructure Grant Programme authorised under the Bipartisan Infrastructure Law are creating the most significant public investment catalyst for e-forecourt market development in North American history, establishing a sustained federal funding pipeline whose deployment is expected to extend through 2026 and 2027 as state-level NEVI plans are fully executed and CFI grant awards are drawn down, providing a regulatory-backed demand signal and risk-mitigating co-investment mechanism that is unlocking private sector e-forecourt development capital at a multiplier of three to five dollars of private investment per federal dollar deployed. The NEVI Formula Programme’s minimum technical specifications requiring four 150-kilowatt direct current fast chargers per station at maximum 50-mile corridor intervals are establishing a national baseline e-forecourt infrastructure standard whose geographic coverage of the entire Interstate Highway System and designated alternative fuel corridors creates a comprehensive charging confidence layer for long-distance BEV travel that independently accelerates consumer battery electric vehicle adoption by eliminating range anxiety as a purchase deterrent, thereby generating the BEV fleet growth that subsequently validates broader commercial e-forecourt investment beyond NEVI-designated corridors. State supplementary investment programmes in California, New York, Texas, Florida, Illinois, and Washington are extending the public investment architecture into metropolitan, suburban, and underserved community locations that NEVI corridor funding does not reach, with California alone committing over USD 2.9 billion in state EV infrastructure investment through 2026 that is catalysing e-forecourt hub development in urban and suburban locations where BEV fleet density already exceeds commercial viability thresholds for high-power hub operations.
Rapid Expansion of Battery Electric Vehicle Fleet Across United States and Canadian Markets Generating Sustained High-Power Public Charging Demand at Commercial Hub Locations
The accelerating penetration of battery electric vehicle new vehicle sales across United States and Canadian markets is expanding the addressable charging demand base for e-forecourt operators at a pace that is progressively converting previously marginal hub site locations into commercially viable high-utilisation charging destinations, as each successive annual increment of BEV fleet growth adds vehicles to the catchment population of established and planned e-forecourt sites and incrementally increases the average daily charging session throughput achievable at hub locations in metropolitan, suburban, and major highway corridor catchments. Battery electric vehicle new vehicle registrations in the United States reached approximately 1.3 million units in 2025, bringing the cumulative United States BEV fleet to approximately 4.2 million vehicles, with projections indicating annual registrations exceeding 3.1 million units by 2030 as federal fuel economy and emissions standards tighten and OEM electric vehicle product portfolio expansion accelerates consumer adoption across previously underserved vehicle segments including light trucks, pickup trucks, and mid-size SUVs that collectively represent the highest-volume United States vehicle categories. E-forecourt operators in established BEV-dense markets report that hub sites in high-traffic interstate interchange and urban arterial locations with catchment BEV fleet densities above 14,000 electric vehicles within a 20-kilometre radius are generating charging bay utilisation rates above 26% on an annualised basis, approaching the breakeven utilisation threshold on charging revenue alone before ancillary retail and fleet account revenue contributions are incorporated, validating the commercial e-forecourt hub model in markets where BEV fleet growth has reached the density required to sustain hub site economics without ongoing public subsidy dependence.
Petroleum Retail Incumbent Network Transformation Programmes Deploying Capital and Real Estate Assets to Convert High-Traffic Travel Centres and Forecourts Into Multi-Service E-Forecourt Hubs
The strategic electrification transition programmes of major North American petroleum retail and travel centre networks represent the largest single source of committed real estate asset deployment into the e-forecourt market, as Pilot Flying J, Love’s Travel Stops, TravelCenters of America, Shell, BP, and EG Group collectively possess the most strategically positioned high-traffic interstate interchange and arterial route site portfolio on the continent, whose existing food service, restroom, convenience retail, and truck parking infrastructure provides the full-service amenity foundation required for premium e-forecourt operations without the incremental capital investment required by greenfield e-forecourt developers to build retail amenity from scratch on unimproved land parcels. Pilot Flying J, operating over 750 travel centres across the United States and Canada, announced a programme to deploy high-power charging infrastructure at 500 locations by 2026 in partnership with General Motors, Tesla, and multiple charging network operators, representing a committed site activation pipeline of high-power charging hub locations that collectively exceeds the total independently developed e-forecourt site count anticipated from all dedicated e-forecourt specialist developers combined through the same timeframe. The competitive urgency driving petroleum retail incumbent e-forecourt investment is reinforced by the recognition that interstate travel centre and high-traffic forecourt sites generating the highest fuel volume revenues today occupy precisely the highway interchange and arterial corridor locations that will generate the highest BEV charging session volumes as fleet electrification advances, creating a long-term site relevance and customer relationship preservation rationale for e-forecourt conversion investment whose strategic value compounds with each successive year of BEV fleet penetration growth across the North American vehicle market.
Key Challenges
Electric Utility Grid Interconnection Delays and Capacity Constraints Limiting High-Power E-Forecourt Deployment Velocity Across Priority Interstate and Urban Locations
The most operationally damaging and commercially consequential challenge confronting e-forecourt developers across North American markets is the severe mismatch between the electrical grid interconnection capacity required to power multi-bay high-power charging hubs, whose simultaneous peak demand can reach one to four megawatts at sites deploying six to sixteen 150-kilowatt to 350-kilowatt chargers operating concurrently, and the available distribution grid infrastructure at the high-traffic interstate interchange and urban arterial locations where e-forecourt site economics are most viable, with new high-power service connections at the required capacity levels carrying processing lead times of 18 to 36 months from utility application submission to service energisation across major electric utility territories in California, Texas, New York, Florida, and other high-priority e-forecourt development states. Electric distribution utilities across the United States are managing interconnection queues that have expanded dramatically with the simultaneous arrival of large-scale renewable energy, industrial electrification, and EV charging infrastructure connection requests, creating a structural processing bottleneck that applies indiscriminately to e-forecourt developer applications regardless of the public policy priority assigned to EV infrastructure deployment by federal and state funding programmes. NEVI programme-funded e-forecourt projects in multiple states have experienced construction completion ahead of utility energisation, with sites physically ready for operation but unable to open due to outstanding grid connection work, translating into completed capital deployment generating zero revenue during utility processing delays that have in some cases extended six to twelve months beyond the planned energisation date. On-site battery energy storage systems are being deployed at an increasing proportion of new e-forecourt sites to reduce peak grid demand requirements and improve resilience during utility supply interruptions, but storage system capital costs of USD 400,000 to USD 1.1 million per installation add materially to already capital-intensive site development budgets.
Geographic Scale and Highway Infrastructure Characteristics of North American Road Networks Creating E-Forecourt Deployment Coverage Gaps in Rural and Low-BEV-Density Corridor Segments
The geographic scale of the North American road network, encompassing over 160,000 kilometres of Interstate Highway System mileage in the United States alone plus equivalent Canadian and Mexican national highway networks, creates an e-forecourt infrastructure coverage challenge whose magnitude substantially exceeds that faced by European e-forecourt developers operating across a more compact and densely populated continental road network, as the commercial viability threshold for e-forecourt hub sites requiring minimum BEV fleet catchment densities of 12,000 to 18,000 electric vehicles within a defined radius is met across a much smaller proportion of North American highway corridor segments than in Europe, leaving extensive rural and lower-population-density interstate corridor segments where BEV fleet density remains insufficient to support commercially self-sustaining e-forecourt hub operations without ongoing public subsidy dependence. The interstate highway corridors traversing Montana, Wyoming, Nebraska, South Dakota, and equivalent low-population-density western and plains state segments present e-forecourt development economics challenges that no commercially viable site format can resolve through charging session revenue optimisation alone given the structural insufficiency of BEV fleet catchment populations along these corridors, requiring sustained public funding support through NEVI formula allocations and CFI grant awards that create a permanent subsidy dependency for rural corridor e-forecourt operations fundamentally different from the trajectory toward commercial self-sufficiency achievable at urban and suburban hub locations in high-BEV-penetration metropolitan markets. The longer average inter-charger distance requirements of North American highway travel relative to European equivalents, reflecting lower population density between major urban centres, also demands higher per-vehicle energy delivery per charging stop, placing greater technical stress on charging equipment and increasing electricity procurement volume per session in ways that intensify operating cost exposure for rural corridor hub operators.
Electricity Tariff Structure Complexity and Demand Charge Exposure Creating Margin Compression Risk for E-Forecourt Operators Across Multiple United States Utility Jurisdictions
E-forecourt operators in the United States face a uniquely complex and commercially damaging electricity tariff challenge relative to their European counterparts, as the structure of commercial electricity tariffs across the majority of United States electric utility jurisdictions imposes substantial demand charges based on peak power draw during the highest 15-minute or 30-minute consumption interval within each billing period, a tariff mechanism whose interaction with the unpredictable and highly variable peak power demand profile of multi-bay high-power charging hubs can result in electricity demand charge costs representing 40% to 65% of total electricity procurement expenditure at e-forecourt sites with low to moderate charging session utilisation rates, fundamentally undermining the charging margin economics that e-forecourt site financial models require to achieve viable returns on invested capital. A six-bay high-power e-forecourt hub simultaneously operating all bays at 150 kilowatts generates a 900-kilowatt instantaneous peak demand that triggers demand charges at commercial retail rates averaging USD 12 to USD 24 per kilowatt of peak monthly demand across major United States utility territories, creating a monthly demand charge liability of USD 10,800 to USD 21,600 that is incurred even if that peak demand level occurs only once during the billing month and even if average hub utilisation across remaining hours is low, creating a structurally punishing cost exposure for newly opened e-forecourt sites in their utilisation ramp period. On-site battery energy storage systems can substantially mitigate demand charge exposure by smoothing peak power draw from the grid through local stored energy discharge during simultaneous multi-vehicle charging events, but the capital investment required for appropriately sized storage systems and the added complexity of storage-integrated site operations require e-forecourt developers to incorporate storage into initial site design rather than retrofitting subsequently, adding USD 400,000 to USD 1.1 million to upfront development capital requirements.
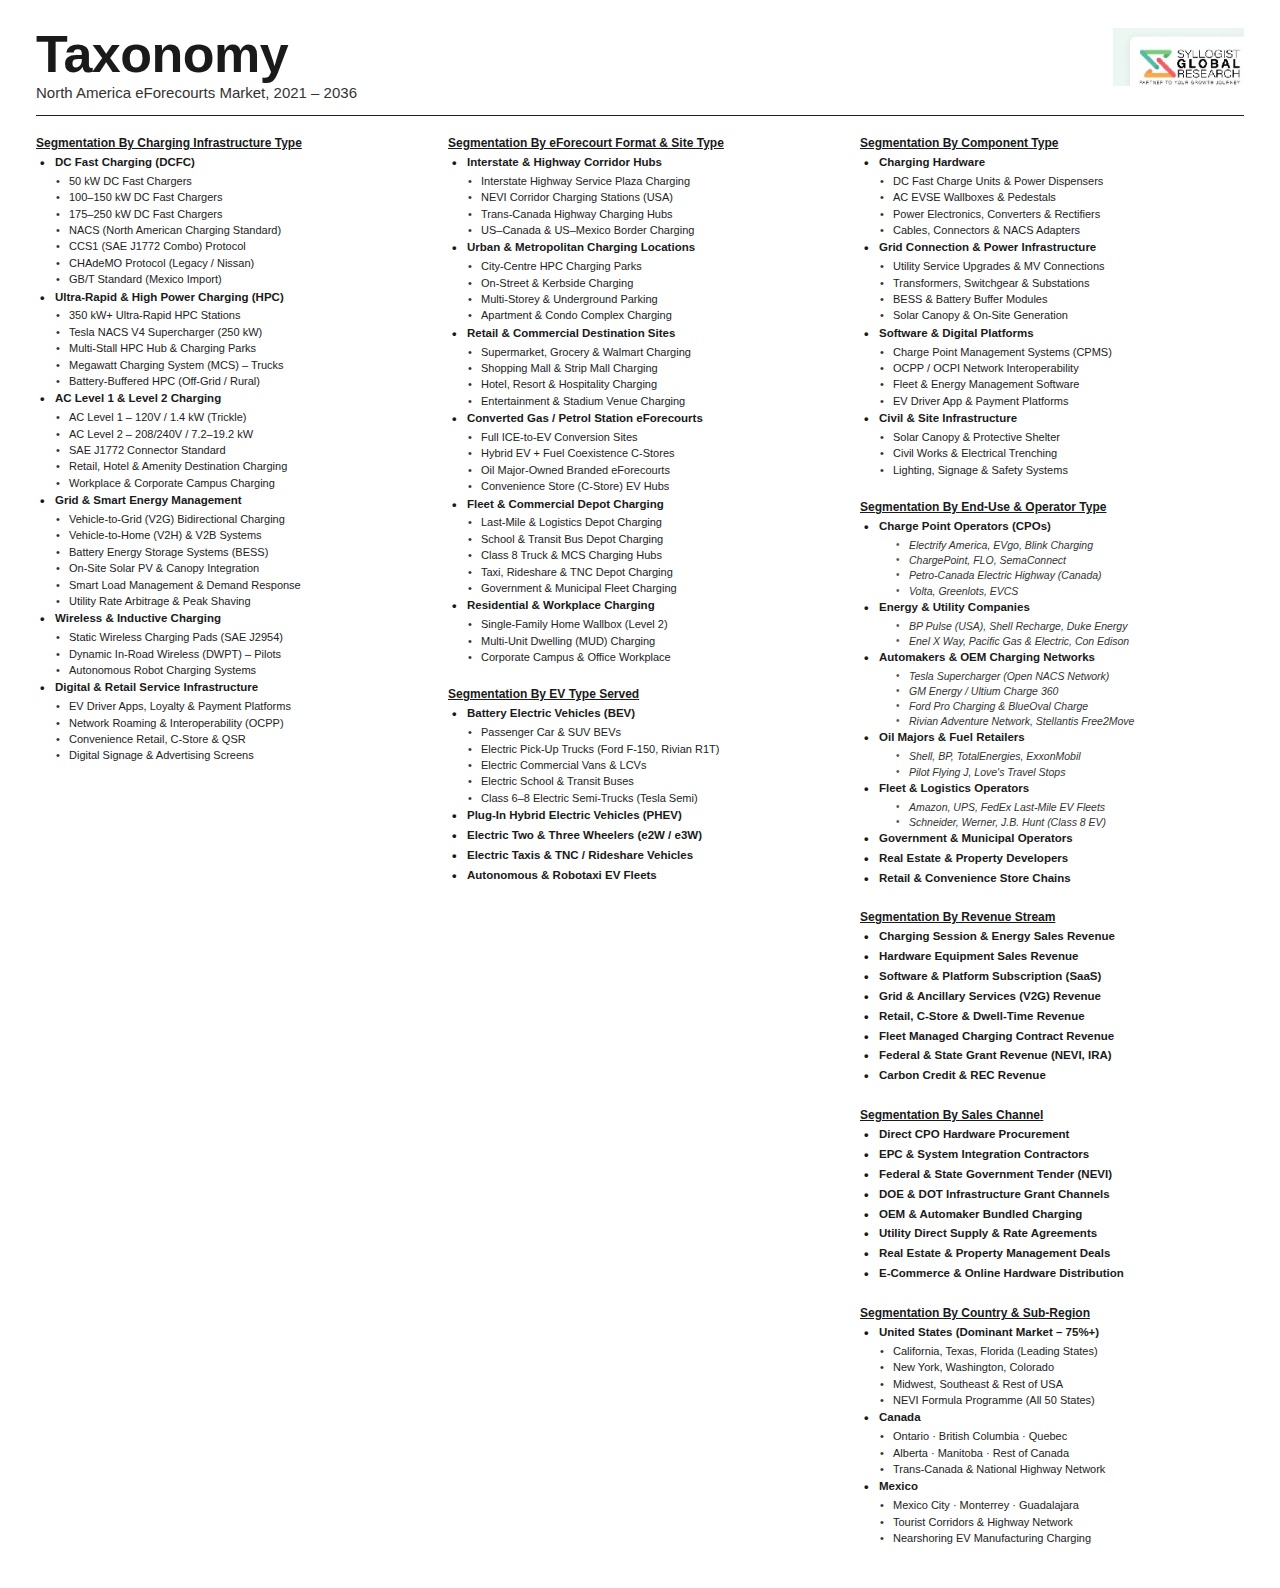
Market Segmentation
- Segmentation By Charging Power Level
- High-Power DC Fast Charging (150 kW to 249 kW)
- Ultra-High-Power DC Fast Charging (250 kW to 349 kW)
- Megawatt-Class DC Fast Charging (350 kW and Above)
- Mixed-Power Hub (Combination of AC Level 2 and DC Fast Charging)
- Others
- Segmentation By Site Type
- Interstate Highway Interchange and Corridor E-Forecourt Hubs
- Urban and Suburban Arterial Route E-Forecourts
- Retail Destination and Shopping Centre E-Forecourts
- Travel Centre and Truck Stop E-Forecourt Conversions
- Converted Petroleum Retail Forecourt Sites
- Purpose-Built Greenfield E-Forecourt Developments
- Airport and Transport Interchange E-Forecourts
- Others
- Segmentation By Number of Charging Bays
- Small Hub Format (2 to 5 Simultaneous Charging Bays)
- Medium Hub Format (6 to 12 Simultaneous Charging Bays)
- Large Hub Format (13 to 24 Simultaneous Charging Bays)
- Mega Hub Format (25 and Above Simultaneous Charging Bays)
- Others
- Segmentation By Operator Type
- Dedicated E-Forecourt Specialist Developers and Operators
- Incumbent Petroleum Retail and Travel Centre Network Operators
- National and Regional EV Charging Network Operators
- Electric Utility and Energy Company-Operated Hubs
- Automaker-Affiliated Charging Network Operators
- Real Estate Developer and Commercial Property-Led Operators
- Public Sector and Municipally Operated Charging Hubs
- Others
- Segmentation By Energy Source
- Grid-Supplied Utility Power With Renewable Energy Certificates
- On-Site Solar Photovoltaic Generation With Grid Backup
- Battery Energy Storage System Integrated Supply
- Combined Solar, Storage, and Grid Hybrid Supply
- Wind Power Purchase Agreement Backed Supply
- Community Choice Aggregation and Green Tariff Backed Supply
- Others
- Segmentation By Ancillary Service Offering
- Convenience Retail and Grocery
- Quick Service Restaurant and Coffee Concessions
- Full-Service and Casual Dining
- Vehicle Wash and Detailing Services
- Restroom and Traveller Amenity Facilities
- Wi-Fi Connectivity and Digital Lounge Amenities
- Fleet Management and Commercial Truck Services
- Advertising and Digital Out-of-Home Media
- Loyalty Programme and Rewards Integration
- Others
- Segmentation By Revenue Model
- Pay-As-You-Go Per-kWh Retail Tariff Charging
- Fleet and Corporate Subscription Account Charging
- Roaming and Network Interoperability Partner Revenue
- Retail Concession and Tenancy Income
- Grid Services and Demand Response Revenue
- Battery Storage Energy Arbitrage Revenue
- Advertising and Sponsorship Revenue
- NEVI and State Programme Co-Funding Revenue
- Others
- Segmentation By Vehicle Type Served
- Passenger Battery Electric Vehicles
- Plug-In Hybrid Electric Vehicles
- Light Commercial Electric Vans and Delivery Vehicles
- Medium and Heavy Electric Commercial Trucks
- Electric Pickup Trucks and SUVs
- Electric Buses and Motorcoaches
- Others
- Segmentation By Country
- United States
- Canada
- Mexico
All market revenues are presented in USD
Historical Year: 2021-2024 | Base Year: 2025 | Estimated Year: 2026 | Forecast Period: 2027-2034
Key Questions this Study Will Answer
- What is the total North America e-forecourts market valuation in the base year 2025, and what is the projected market size and compound annual growth rate through 2034, disaggregated by charging power level across high-power DC fast, ultra-high-power DC fast, and megawatt-class charging categories, by site type across interstate highway hubs, urban and suburban arterial e-forecourts, travel centre conversions, retail destination sites, and purpose-built greenfield developments, and by country across the United States, Canada, and Mexico, to enable e-forecourt developers, charging network operators, petroleum retail incumbents, electric utilities, infrastructure investors, and equipment manufacturers to identify which site formats, power configurations, and national markets will generate the highest absolute revenue growth and the most commercially validated hub economics across the forecast period as North American BEV fleet penetration accelerates and federal NEVI and CFI programme deployment catalyses private co-investment at scale?
- How are the National Electric Vehicle Infrastructure Formula Programme and Charging and Fueling Infrastructure Grant Programme allocations under the Bipartisan Infrastructure Law translating into confirmed e-forecourt development pipeline volumes by state, corridor, and operator category across the United States, and what is the projected split of NEVI and CFI-catalysed infrastructure deployment between petroleum retail incumbent network upgrades, dedicated e-forecourt specialist developer sites, charging network operator hub programmes, and automaker-affiliated charging infrastructure investments, at what per-site capital cost and charging bay count configurations, and across what deployment timeline through 2030 that would enable infrastructure investors, charging equipment suppliers, and electric utility interconnection planners to calibrate their capital allocation, manufacturing capacity, and grid upgrade investment programmes to the federally catalysed e-forecourt development pipeline at the granularity required for informed business planning?
- What are the detailed unit economics of a commercially representative North American e-forecourt hub at 2025 operational benchmarks and projected 2030 maturity benchmarks, including total site development capital cost per charging bay by site type, power level, and geographic location, average charging bay utilisation rate by market and site category, charging session revenue per kilowatt-hour at market-average retail tariff levels, electricity demand charge exposure as a proportion of total electricity procurement cost by utility territory and hub power configuration, ancillary retail and fleet account revenue contribution as a percentage of total site revenue, and the minimum BEV fleet catchment density within a defined radius required to achieve site-level charging revenue breakeven for each hub format category, providing a rigorous commercial viability framework that distinguishes metropolitan and highway corridor high-viability locations from rural and low-density corridor segments requiring sustained public funding support through the forecast period?
- How are electric utility grid interconnection delays, demand charge tariff structures across United States utility jurisdictions, and the capital and operational complexity of on-site battery energy storage system integration affecting e-forecourt development pipeline execution timelines, site financial returns, and operator investment decisions across the North American market, and what are the specific mitigation strategies being deployed by leading e-forecourt operators including demand charge management through battery storage dispatch optimisation, long-term power purchase agreements with renewable generators, utility green tariff programme participation, and community choice aggregation procurement that are reducing electricity cost exposure and improving site development predictability, at what capital investment requirement and what quantified reduction in effective electricity cost per kilowatt-hour delivered to EV drivers at operational hub sites providing commercial reference data for wider industry adoption across new site developments?
- Who are the leading e-forecourt developers, dedicated EV charging hub operators, petroleum retail and travel centre network operators executing electrification conversion programmes, automaker-affiliated charging network operators, electric utility-backed infrastructure investors, and charging equipment manufacturers currently defining the competitive landscape of the North America e-forecourts market, and what are their respective operational site portfolio sizes and confirmed development pipeline commitments by state and site format, capital investment programmes and funding structures including NEVI and CFI grant utilisation, federal investment tax credit and accelerated depreciation programme benefits, and private equity and infrastructure fund co-investment, charging equipment supplier relationships and preferred technology platform selections, quick service restaurant and convenience retail concession partnership models generating ancillary revenue at hub sites, energy procurement and on-site generation strategies managing electricity demand charge exposure and renewable supply credentialing, and strategic competitive positioning relative to Tesla Supercharger network expansion and the BEV fleet growth trajectory that defines the market development pace and commercial opportunity across United States, Canadian, and Mexican e-forecourt markets through 2034?
- Product Definition
- Research Methodology
- Research Design & Framework
- Overall Research Approach: Descriptive, Exploratory & Quantitative Mixed-Method Design
- Market Definition & Scope Boundaries: What is Included and Excluded
- Segmentation Framework
- Key Research Assumptions & Limitations
- Secondary Research
- Primary Research Design & Execution
- Data Triangulation & Validation
- Market Sizing & Forecasting Methodology
- Competitive Intelligence Methodology
- Quality Assurance & Peer Review
- Definitions, Abbreviations & Data Notes
- Research Design & Framework
- Executive Summary
- Market Snapshot & Headline Numbers
- Key Findings & Research Highlights
- Market Dynamics
- Country Market Summary
- Competitive Landscape Snapshot
- Technology & Innovation Highlights
- Market Dynamics
- Drivers
- Restraints
- Opportunities
- Challenges
- Porter’s Five Forces Analysis
- PESTLE Analysis
- Market Trends & Developments
- Emerging Trends
- Technological Developments
- Regulatory & Policy Changes
- Supply Chain & Sourcing Trends
- Manufacturing & Process Trends
- Investment & Funding Activity
- Sustainability & ESG Trends
- Risk Assessment Framework
- Grid Capacity, Power Infrastructure Upgrade Cost & Electricity Network Constraint Risk
- EV Adoption Rate Uncertainty, Charging Demand Forecasting & Utilisation Risk
- Cybersecurity, Payment System Fraud & Connected Charging Infrastructure Vulnerability Risk
- Real Estate Availability, Planning Permission, Land Cost & Site Development Risk
- Technology Obsolescence, Charging Standard Fragmentation & Stranded Asset Risk
- Regulatory Framework & Standards
- US Federal EV Charging Infrastructure Policy: NEVI Programme, Bipartisan Infrastructure Law & DOE Funding Frameworks
- Canadian Zero-Emission Vehicle Infrastructure Programme (ZEVIP), EVSE Grant Schemes & Provincial EV Charging Mandates
- Mexican EV Charging Regulation, NOM Standards & Federal Clean Energy Incentive Frameworks
- Interoperability & Roaming Standards: OCPP, OCPI, ISO 15118, SAE J1772 & NACS Plug & Charge Requirements
- Electricity Retail Licensing, Tariff Regulation, Smart Charging Grid Balancing & Consumer Pricing Transparency Regulations
- North America e-Forecourts Market Outlook
- Market Size & Forecast by Value
- Market Size & Forecast by Volume (Number of Sites, Charging Points & Sessions)
- Market Size & Forecast by Infrastructure Component
- DC Fast Charging Equipment: 50 kW to 150 kW Rapid Chargers & Associated Switchgear
- Ultra-Rapid & High-Power Charging (HPC) Equipment: 150 kW to 350 kW+ Dispensers
- AC Destination Charging Infrastructure: 7 kW to 22 kW Chargers for Dwell-Time Locations
- Grid Connection & Electrical Infrastructure: Transformers, Switchboards & Cable Ducting
- Battery Energy Storage Systems (BESS) for Peak Shaving, Grid Stability & Demand Management
- On-Site Renewable Energy Generation: Solar PV Canopies, Wind Integration & Microgrid Systems
- Digital Infrastructure: Payment Terminals, CPMS Software, Network Connectivity & Back-Office Platform
- Canopy, Forecourt Civil Works, Lighting, Signage & Customer Amenity Infrastructure
- Market Size & Forecast by Technology
- Combined Charging System (CCS1 & CCS2) DC Fast & Ultra-Rapid Charging Technology
- Tesla NACS (North American Charging Standard) & Supercharger Network Technology
- SAE J1772 & AC Type 2 Destination Charging Technology
- CHAdeMO Protocol Charging Technology
- ISO 15118 Plug & Charge (PnC) & Vehicle-to-Grid (V2G) Bidirectional Charging Technology
- Dynamic Load Management, Smart Charging & Demand Response Technology
- Battery Energy Storage Integration & On-Site Renewable Energy Coupling Technology
- AI-Enabled Site Optimisation, Predictive Maintenance & Customer Analytics Technology
- Market Size & Forecast by Charging Speed
- Rapid Charging (50 kW to 149 kW)
- Ultra-Rapid Charging (150 kW to 349 kW)
- High-Power Charging (350 kW and Above)
- Destination & AC Charging (Up to 22 kW)
- Market Size & Forecast by Site Format
- Purpose-Built Standalone e-Forecourt: Large-Format EV-Only Charging Hub
- Converted Petrol Forecourt: Legacy Fuel Retail Site Retrofitted with EV Charging Infrastructure
- Highway Corridor & Interstate Rest Area Charging Hub
- Retail, Supermarket & Shopping Centre Integrated Charging Forecourt
- Hotel, Hospitality & Leisure Venue Integrated Charging Forecourt
- Fleet Depot, Logistics Hub & Commercial Vehicle Charging Forecourt
- Urban & City Centre Fast Charging Hub
- Market Size & Forecast by Application
- Passenger Car Public Charging
- Light Commercial Vehicle (LCV) & Last-Mile Delivery Fleet Charging
- Heavy Commercial Vehicle (HCV), Bus & Coach High-Power Charging
- Ride-Hailing, Taxi Fleet & Shared Mobility Operator Charging
- Hydrogen Fuel Cell Vehicle (FCEV) Dispensing at Integrated e-Forecourt Sites
- Market Size & Forecast by End-User
- Private EV Drivers & Consumer Retail Charging Customers
- Fleet Operators & Corporate Mobility Managers
- Fuel Retail & Forecourt Operators
- Highway & Interstate Corridor Operators
- Real Estate Developers, Retail Parks & Hospitality Groups
- Municipalities, Local Authorities & Public Infrastructure Bodies
- Market Size & Forecast by Revenue Model
- Pay-As-You-Go: Per kWh, Per Minute & Per Session Pricing
- Subscription & Membership Model: Monthly & Annual Roaming Pass
- White-Label & Franchise Network Licensing Model
- Ancillary Revenue: Retail, Food & Beverage, Advertising & Loyalty Programme
- Vehicle-to-Grid (V2G) & Grid Services Revenue: Frequency Response & Demand Turn-Down
- Market Size & Forecast by Country
- United States
- Canada
- Mexico
- United States e-Forecourts Market Outlook
- Market Size & Forecast
- By Value
- By Volume (Number of Sites, Charging Points & Sessions)
- By Infrastructure Component
- By Technology
- By Charging Speed
- By Site Format
- By Application
- By End-User
- By Revenue Model
- By State
- Market Size & Forecast
- Canada e-Forecourts Market Outlook
- Market Size & Forecast
- By Value
- By Volume (Number of Sites, Charging Points & Sessions)
- By Infrastructure Component
- By Technology
- By Charging Speed
- By Site Format
- By Application
- By End-User
- By Revenue Model
- By Province
- Market Size & Forecast
- Mexico e-Forecourts Market Outlook
- Market Size & Forecast
- By Value
- By Volume (Number of Sites, Charging Points & Sessions)
- By Infrastructure Component
- By Technology
- By Charging Speed
- By Site Format
- By Application
- By End-User
- By Revenue Model
- By Region
- Market Size & Forecast
- Technology Landscape & Innovation Analysis
- Ultra-Rapid & High-Power Charging (HPC) Hardware: 350 kW+ Dispenser & Liquid-Cooled Cable Technology Deep-Dive
- ISO 15118 Plug & Charge, NACS Adoption & Vehicle-to-Grid (V2G) Bidirectional Energy Flow Technology
- On-Site Battery Energy Storage (BESS) Integration: Peak Shaving, Grid Arbitrage & Backup Power Technology
- Solar PV Canopy, On-Site Renewable Generation & Microgrid Control Technology for e-Forecourts
- Dynamic Load Management, Smart Charging Optimisation & Demand Response Technology
- AI-Enabled Site Operations: Predictive Maintenance, Utilisation Forecasting & Customer Experience Personalisation
- Payment, Roaming & CPMS Platform Technology: OCPP 2.0.1, OCPI & Open Standards Back-Office Integration
- Patent & IP Landscape in e-Forecourt & EV Charging Infrastructure Technologies
- Value Chain & Supply Chain Analysis
- Charging Equipment OEM & Power Electronics Component Supply Chain
- Battery Energy Storage System & On-Site Renewable Energy Equipment Supply Chain
- Grid Connection, Transformer, Switchgear & Electrical Balance-of-Plant Supply Chain
- Civil Engineering, Canopy Construction & Forecourt Fitout Supply Chain
- CPMS Software, Payment Platform & Network Connectivity Supply Chain
- CPO, Site Developer, Fuel Retailer & Real Estate Partner Channel
- Operations, Maintenance, Remote Monitoring & Asset Management Service Channel
- Pricing Analysis
- DC Fast & Ultra-Rapid Charger Hardware Unit Cost & Total Site Capital Expenditure Analysis
- Grid Connection Upgrade & Electrical Infrastructure Cost Analysis by Site Scale
- BESS & On-Site Solar PV Integration Capital Cost & Payback Period Analysis
- Per kWh, Per Minute & Session-Based Consumer Pricing Benchmarking Across United States, Canada & Mexico
- CPO Revenue, Operating Cost & Site-Level EBITDA Economics Analysis
- Total e-Forecourt Development Economics: CapEx, OpEx, Revenue & Return on Investment Modelling
- Sustainability & Environmental Analysis
- Lifecycle Assessment (LCA) of e-Forecourt Infrastructure: Embodied Carbon, Operational Energy & End-of-Life
- Renewable Energy Sourcing, Green Tariff Procurement & Carbon-Neutral Charging Site Certification
- BESS Second-Life Battery Integration: Repurposed EV Battery Use & Environmental Benefit Assessment
- EV Charging vs. Petrol Forecourt: Well-to-Wheel Carbon Savings & Air Quality Improvement Contribution
- ESG Reporting, Net Zero Commitments & Sustainable Site Design Standards for North American e-Forecourt Operators
- Competitive Landscape
- Market Structure & Concentration
- Market Consolidation Level (Fragmented vs. Consolidated by Site Format & Country)
- Top 10 Players Market Share
- HHI (Herfindahl-Hirschman Index) Concentration Analysis
- Competitive Intensity Map by Site Format, Charging Speed & Country
- Player Classification
- Pure-Play Charge Point Operators (CPOs) & e-Forecourt Network Developers
- Legacy Fuel Retail Groups Transitioning to e-Forecourt Operators
- Highway Corridor & Interstate Charging Network Operators
- Utility & Energy Company-Backed Charging Infrastructure Developers
- Charging Equipment OEMs with Network & CPO Capabilities
- Real Estate, Retail & Hospitality Groups Integrating e-Forecourt Infrastructure
- Technology & Software Platform Providers: CPMS, Roaming & Smart Charging Solutions
- Start-ups & New Entrants in High-Power Charging Hub Development
- Competitive Analysis Frameworks
- Market Share Analysis by Site Format, Technology & Country
- Company Profile
- Company Overview & Headquarters
- e-Forecourt Network Size, Site Portfolio & Charging Point Count
- Key Customer Relationships, Site Partnerships & Real Estate Network
- Geographic Footprint & Expansion Pipeline
- Revenue (e-Forecourt & Charging Segment) & Utilisation Rates
- Technology Differentiators & IP
- Key Strategic Partnerships, JVs & M&A Activity
- Recent Developments (Site Openings, Network Expansions, Technology Upgrades)
- SWOT Analysis
- Strategic Focus Areas & Roadmap
- Competitive Positioning Map (Network Scale vs. Charging Speed Capability)
- Key Company Profiles
- Market Structure & Concentration
- Strategic Opportunity Analysis
- Strategic Output
- Market Opportunity Matrix: By Infrastructure Component, Site Format, Application, End-User & Country
- White Space Opportunity Analysis
- Strategic Recommendations
- Product Portfolio & Technology Investment Strategy
- Site Development & Operational Excellence Strategy
- Geographic Expansion & Localisation Strategy
- Customer & End-User Engagement Strategy
- Partnership, M&A & Ecosystem Strategy
- Sustainability & Circular Economy Strategy
- Risk Mitigation & Future Roadmap
- Strategic Priority Matrix & Roadmap
- Near-term (2025-2028)
- Mid-term (2029-2032)
- Long-term (2033-2037)
- Strategic Output