Market Definition
The Global Augmented Reality Shopping Platforms Market encompasses the development, deployment, and commercialization of technology systems that superimpose photorealistic three-dimensional product representations, virtual try-on experiences, and contextually anchored spatial product visualizations onto the physical or digital environments perceived by shoppers through smartphone cameras, tablet screens, dedicated AR headsets, and web-based augmented reality interfaces, enabling consumers to evaluate product fit, scale, appearance, and spatial compatibility within their own living environments or on their physical persons before completing a purchase decision across e-commerce, m-commerce, and in-store retail channels. Augmented reality shopping platforms transform the traditional product discovery and purchase evaluation process by collapsing the experiential gap between digital browsing and physical product assessment that has historically elevated return rates, suppressed consumer purchase confidence, and constrained e-commerce penetration in product categories including furniture, home decor, apparel, footwear, eyewear, cosmetics, and accessories where touch, scale, fit, and spatial harmony with the buyer’s environment are critical purchase decision inputs.
The market encompasses AR visualization software development kits and application programming interfaces enabling retailers to embed augmented reality product experiences within their native mobile applications and e-commerce websites; web-based augmented reality platforms delivering browser-native AR experiences without requiring application download through WebAR and WebXR framework deployments; virtual try-on platforms serving apparel, footwear, eyewear, jewelry, and cosmetics retailers through facial recognition, body measurement, and real-time rendering technologies; room visualization and spatial placement platforms enabling furniture, home appliance, and home improvement retailers to present three-dimensional products anchored within the shopper’s scanned room environment; and enterprise augmented reality commerce platforms integrating product configurator, photorealistic 3D asset management, and AR delivery infrastructure with existing e-commerce platforms, product information management systems, and digital asset management workflows. Key participants include augmented reality software platform providers, three-dimensional product visualization technology companies, computer vision and spatial computing infrastructure developers, major e-commerce platform operators integrating native AR shopping capabilities, retail brands deploying AR as a competitive differentiation tool across fashion, beauty, furniture, and consumer electronics categories, and device hardware manufacturers whose smartphone and wearable AR hardware capabilities define the technical envelope within which AR shopping experiences are delivered to consumer end users globally.
Market Insights
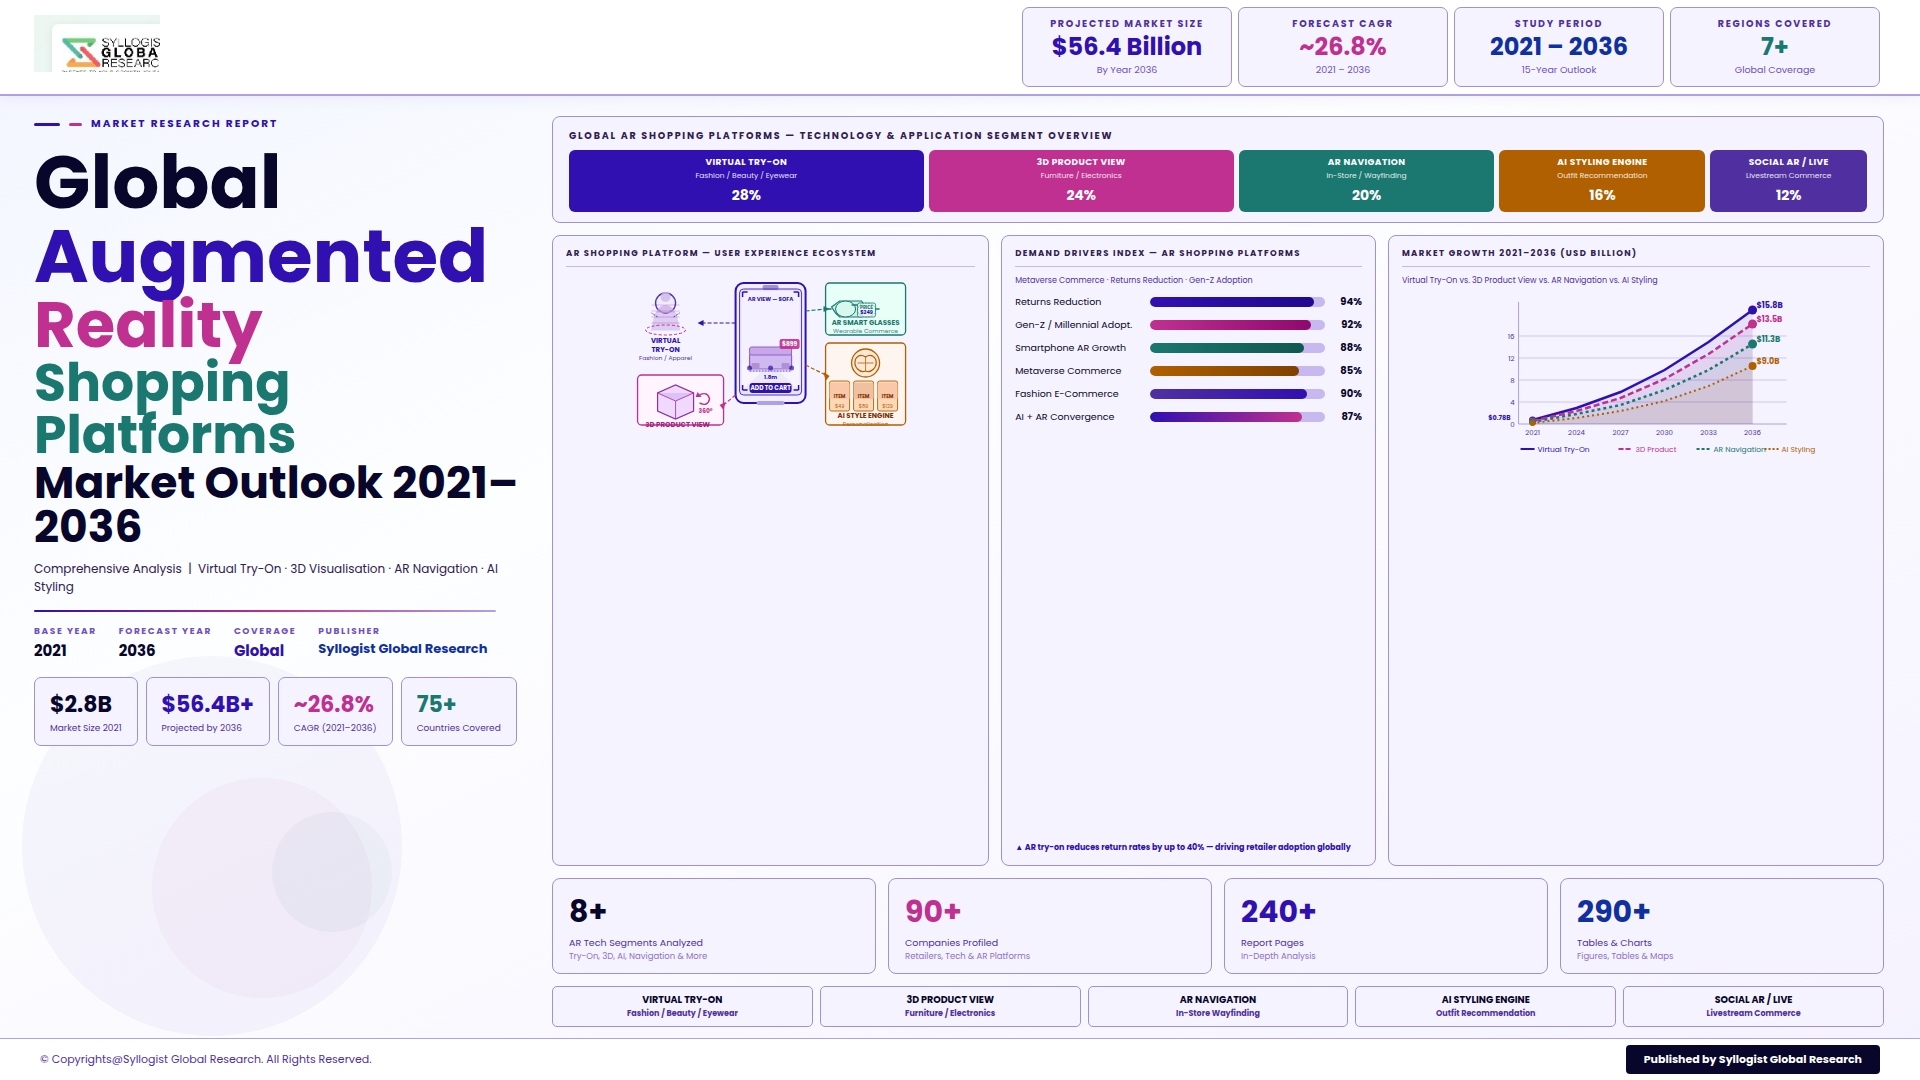
The global augmented reality shopping platforms market is transitioning from a period of technology demonstration and consumer novelty toward a phase of commercial maturity and measurable retail performance impact, driven by the accumulation of rigorous retailer-side evidence that AR shopping experiences generate statistically significant improvements in consumer purchase conversion rates, average order values, and product return rate reduction that translate into quantifiable financial return on AR platform investment across fashion, furniture, beauty, and home improvement retail categories. The global augmented reality shopping platforms market was valued at approximately USD 5.8 billion in 2025 and is projected to reach USD 26.4 billion by 2034, advancing at a compound annual growth rate of 18.3% over the forecast period from 2027 to 2034, driven by the accelerating integration of AR shopping functionality within major e-commerce platform ecosystems including Shopify, Salesforce Commerce Cloud, and Adobe Commerce, the progressive democratization of high-quality 3D product asset creation through AI-powered automated modeling tools that have dramatically reduced the per-SKU cost of AR content production, and the commercial normalization of smartphone-based AR shopping experiences among Millennial and Gen Z consumer demographics whose device proficiency and digital shopping behavior make AR try-on and visualization features an expected rather than exceptional element of premium retail brand digital experience.
The furniture and home decor segment constitutes the most commercially mature and highest-revenue application category within the global AR shopping platforms market, having achieved broad mainstream consumer adoption through the widely deployed room visualization features of IKEA Place, Wayfair’s View in Room 3D, Amazon’s View in Your Room, and the AR functionality embedded within the apps of major home improvement retailers including Home Depot and Lowes, whose collective deployment across hundreds of millions of smartphone users has demonstrated that spatial product placement AR technology generates conversion rate improvements of 20% to 40% compared to conventional product photography presentation in furniture and home decor categories where scale accuracy, color matching with existing room elements, and proportional compatibility with room dimensions are the primary purchase hesitation factors that AR visualization directly resolves. The quality of the 3D product asset pipeline has emerged as the critical commercial differentiator between AR shopping programs that deliver genuine consumer decision support and those that generate initial novelty engagement without sustained conversion impact, with photorealistic 3D models incorporating accurate material texture rendering, real-world light response behavior, and dimensionally precise geometry proving substantially more effective in reducing return rates and improving purchase confidence than lower-fidelity 3D representations that fail to replicate the physical product appearance with sufficient accuracy to substitute for in-store physical examination. Retailers including IKEA, Wayfair, and Williams-Sonoma have each invested substantially in developing large-scale 3D product asset libraries covering tens of thousands of SKUs, with IKEA having developed 3D digital twins for its entire product catalog, demonstrating the strategic commitment to AR content infrastructure investment that is becoming a competitive necessity for furniture and home retailers whose e-commerce growth trajectories are dependent on resolving the scale and fit anxiety that constrains online furniture purchase conversion.
The beauty and cosmetics virtual try-on segment represents the most consumer-engaged and highest daily active user AR shopping application globally, having achieved mass consumer adoption through the Snap Camera AR lens ecosystem, the virtual try-on features integrated within Sephora’s Virtual Artist, MAC Cosmetics’ virtual try-on, and the AI-powered beauty AR tools embedded within TikTok Shop and Instagram Shopping that enable consumers to test lipstick shades, eyeshadow palettes, and foundation undertones on their own live camera image within seconds without physical product application. Perfect Corp, whose YouCam Makeup and YouCam Try-On platforms serve over 1,100 beauty and personal care brand partners globally and have generated over 10 billion virtual try-on experiences across their consumer-facing applications, represents the most commercially advanced independent AR beauty platform provider whose technology has been deployed across the e-commerce, in-store kiosk, and social media channels of L’Oreal, Estee Lauder, Shiseido, Coty, and hundreds of independent beauty brands seeking AR-powered consumer engagement capabilities without the internal technology development investment required to build comparable platforms independently. The documented return rate reduction impact of beauty virtual try-on is particularly commercially significant given that cosmetic product returns generate both financial loss and consumer hygiene concerns, with beauty retailers reporting return rate reductions of 25% to 35% on products purchased following virtual try-on engagement compared to conventional product photography purchase journeys, creating a direct and measurable financial return from AR platform investment that has been critical in justifying technology budget allocation within beauty retail organizations whose marketing and technology investment frameworks require quantifiable ROI evidence for new capability development.
The apparel and footwear virtual try-on segment is the most technically challenging and most actively developing frontier within the global AR shopping platforms market, as the accurate simulation of fabric drape, garment fit variation across body size and shape diversity, footwear proportional appearance on different foot anatomies, and the dynamic visual behavior of textiles in motion demands computational capabilities and body modeling sophistication that are substantially more demanding than the static spatial placement technology underlying furniture AR or the face-anchored cosmetics try-on that constitutes the current commercial AR beauty standard. Snap’s AR Shopping platform, which hosts thousands of branded virtual try-on lenses for apparel and footwear brands including Gucci, Ralph Lauren, Under Armour, and Adidas, and the acquisition of AR technology companies including Vertebrae by Snap and Zeekit by Walmart have concentrated significant engineering investment in apparel AR technology development whose output is progressively improving the realism and size accuracy of virtual clothing try-on experiences. The size and fit recommendation dimension of apparel AR, where AI body measurement tools using front-and-side smartphone camera image pairs generate personalized size recommendations that reduce size-related returns rather than purely providing visual appearance simulation, is commercially proving more immediately impactful than photorealistic garment AR in terms of e-commerce return rate reduction, with platforms including Fit Analytics, True Fit, and Virtusize demonstrating that AI-powered fit recommendation technologies generate return rate reductions of 20% to 30% that complement and enhance the visual engagement benefits of pure augmented reality garment visualization. Regional market dynamics reflect varying AR shopping adoption rates with North America and East Asia representing the most advanced deployment markets by retailer investment, consumer adoption rate, and platform technology maturity, while Europe is characterized by strong fashion and luxury brand AR investment, and Southeast Asia’s mobile-first commerce culture and social commerce integration are driving rapid beauty and fashion AR adoption through TikTok Shop and regional platform integrations.
Key Drivers
E-Commerce Return Rate Crisis Across Fashion, Furniture, and Beauty Categories Compelling Retailer Investment in AR Experience Technology as a Proven Returns Reduction Tool
The chronic and escalating product return rate crisis afflicting global e-commerce operators, with apparel return rates averaging 25% to 40% of shipped orders, furniture and home decor returns averaging 10% to 20%, and beauty product returns generating both financial loss and consumer safety concerns, is imposing a total annual returns processing cost estimated at over USD 800 billion globally that is compelling retailers of all scales to invest in technology solutions whose ability to resolve the pre-purchase uncertainty that drives return behavior is demonstrably evidenced through measurable return rate reduction outcomes. The financial impact of a single percentage point reduction in return rate for a large-scale fashion e-commerce operator processing several million annual orders translates into millions of dollars of annual cost avoidance across reverse logistics, product refurbishment, re-merchandising, and customer service expenditure, creating an ROI calculation framework for AR shopping platform investment that generates compelling payback periods of twelve to thirty-six months at the return rate reduction magnitudes that commercial AR try-on platform deployments have documented. The regulatory dimension of e-commerce returns management is intensifying the commercial urgency of return rate reduction investment, with the European Union’s proposed restrictions on the free disposal of unsold and returned textile products, California’s extended producer responsibility legislation for apparel, and the growing reputational pressure on major retailers from sustainability advocacy organizations documenting the environmental cost of reverse logistics and returned product landfill disposal, making return rate reduction through AR a commercially and reputationally strategic investment priority rather than a discretionary technology experiment for retail organizations whose sustainability credentials are subject to consumer and regulatory scrutiny.
Apple Vision Pro, Meta Quest, and Smartphone AR Hardware Advancement Expanding the Consumer Device Base for High-Fidelity AR Shopping Experiences
The commercial launch of Apple Vision Pro in February 2024 at a USD 3,499 price point, representing Apple’s entry into the spatial computing market with a mixed reality headset whose display quality, spatial audio, and hand tracking capabilities substantially exceed the visual and interactive fidelity of smartphone-screen AR experiences, signals the beginning of a hardware development cycle whose successive generations will progressively reduce the price, weight, and social acceptability barriers to wearable AR device adoption and expand the consumer device base for immersive AR shopping experiences beyond the current smartphone camera AR modality toward fully spatial commerce environments where product evaluation occurs in photorealistic three-dimensional virtual showroom contexts. The installed base of AR-capable smartphones, whose LiDAR scanner integration in Apple iPhone Pro and Pro Max models enables precise spatial mapping and photorealistic product placement with accurate depth occlusion, has reached approximately 850 million devices globally as of 2025, providing AR shopping platform developers with a large and technically capable consumer device substrate on which high-quality furniture, home decor, and large format product AR experiences can be delivered without requiring specialized hardware investment by consumers. The advancement of on-device neural processing capabilities in Apple A-series and Qualcomm Snapdragon chips is progressively enabling real-time generative AI-powered try-on experiences, dynamic lighting adaptation, and photorealistic material rendering within mobile AR shopping applications without requiring cloud computation round-trips that introduce latency incompatible with the fluid real-time visual experience that effective AR shopping requires, creating a hardware capability foundation that is outpacing the current sophistication of most commercial AR shopping platform implementations and providing a performance headroom that AR platform developers are progressively exploiting through more demanding rendering and simulation capabilities.
Social Commerce Integration and Influencer-Driven AR Try-On Experiences Normalizing AR Shopping Behavior Among Gen Z and Millennial Consumer Populations
The integration of augmented reality try-on and product visualization features within the social media platforms where Millennial and Gen Z consumers spend the majority of their digital leisure time, specifically Snap, TikTok, Instagram, and Pinterest, is normalizing AR shopping behavior by embedding product try-on and room visualization experiences within entertainment and social content consumption contexts that generate high engagement frequency and low adoption friction relative to standalone retail application AR features that require deliberate navigation and engagement intent to access. Snap’s AR advertising platform, which reported that AR Lens ads generate 94% higher purchase intent compared to standard video ads among Snapchat’s primarily Gen Z user base, and TikTok Shop’s virtual try-on features that enable users to apply branded beauty and apparel AR experiences directly within the TikTok content feed without leaving the platform, represent the commercial vanguard of social AR commerce whose demonstrated engagement and conversion performance is compelling consumer goods brands and retailers to allocate growing proportions of their digital marketing budgets toward social AR advertising formats. The social sharing dimension of AR try-on experiences, where consumers photograph and share their AR product trials on social media generating organic earned media impressions for the featured brand alongside user-generated content that conveys authentic product endorsement, creates a marketing efficiency multiplier for AR-equipped brands whose product discovery and awareness reach extends substantially beyond the direct user of the AR experience to the social audience of their followers, making AR shopping platform investment jointly a customer experience improvement and brand marketing investment whose total commercial return encompasses both direct conversion improvement and earned media amplification effects.
Key Challenges
High Cost and Production Complexity of Photorealistic 3D Product Asset Creation Limiting AR Shopping Deployment Scale Across Mid-Market and SME Retailers
The deployment of effective augmented reality shopping experiences is fundamentally dependent on the availability of high-quality photorealistic three-dimensional product digital assets whose accurate material texture, dimensional precision, and real-world lighting response are the technical prerequisites for AR product visualization that meaningfully substitutes for physical product examination in consumer purchase decision-making, yet the production of these assets through professional 3D modeling, photogrammetry scanning, and CGI rendering workflows has historically cost between USD 200 and USD 2,000 per product SKU at quality levels adequate for consumer-facing AR shopping, creating a prohibitive content production investment barrier for mid-market and SME retailers whose product catalogs encompass thousands of SKUs requiring AR asset creation before meaningful AR shopping program coverage can be achieved. The organizational complexity of establishing and maintaining 3D asset production pipelines within retail organizations whose product catalogs evolve through seasonal merchandise cycles, frequent new product introductions, and product variant proliferation across color, size, and configuration options requires dedicated digital asset management infrastructure, production workflow tooling, and ongoing vendor management or in-house capability investment that adds organizational overhead beyond the technology platform licensing costs that typically anchor AR shopping business case calculations. The advent of AI-powered automated 3D model generation tools, including those developed by Luma AI, Stability AI, and the 3D content generation capabilities embedded within Adobe Firefly and Apple’s Object Capture framework, is progressively reducing the per-SKU production cost of AR-quality 3D assets toward USD 20 to USD 80 per product through automated photogrammetry and neural radiance field reconstruction workflows, but the quality consistency, material accuracy, and production throughput of AI-generated 3D assets relative to manually crafted professional models remains a source of quality uncertainty for premium brand AR program deployments where visual fidelity standards are non-negotiable.
Consumer Privacy Concerns and Biometric Data Regulatory Compliance Requirements Constraining AR Try-On Feature Deployment in Regulated Markets
The consumer-facing implementation of facial recognition-based cosmetics and eyewear virtual try-on, body measurement-based apparel fit technology, and spatial room mapping for furniture placement AR involves the collection, processing, and in some implementations the storage or transmission of biometric data, facial geometry measurements, body dimension data, and detailed indoor spatial mapping information whose regulatory treatment under the European Union General Data Protection Regulation, the Illinois Biometric Information Privacy Act, the California Consumer Privacy Act, and equivalent privacy legislation in Canada, Australia, Brazil, and multiple Asian jurisdictions creates substantial legal compliance obligations, consumer consent management requirements, and data governance infrastructure investment burdens for AR shopping platform operators and the retail brands deploying their technology. The Illinois Biometric Information Privacy Act, whose private right of action provisions have generated over USD 1 billion in class action settlement payments against technology companies collecting facial geometry data without explicit informed consent, represents the most commercially consequential privacy compliance risk facing AR shopping platform operators deploying facial try-on features in US markets, and has caused several major AR platform providers to restructure their facial data processing architectures from server-side facial geometry extraction toward on-device processing models that avoid biometric data transmission and storage but impose higher computational requirements on consumer device hardware. The regulatory fragmentation of biometric data protection standards across national and sub-national jurisdictions globally requires AR shopping platform operators to maintain jurisdiction-specific compliance architectures, consent management workflows, and data processing documentation that add engineering complexity and ongoing legal counsel costs to AR platform operations, particularly for global platform deployments serving consumers across multiple regulatory environments with materially different consent, storage, and deletion obligation requirements.
Inconsistent AR Experience Quality Across Device Types and Consumer Technical Literacy Barriers Limiting Universal Adoption and Engagement Depth
The delivery of consistent, high-quality augmented reality shopping experiences across the heterogeneous global consumer device landscape, which spans from the latest LiDAR-equipped flagship smartphones delivering precise spatial tracking and photorealistic rendering to mid-range and budget Android devices with limited processing power, inadequate camera quality, and absent depth sensing hardware that can only support basic marker-based or screen-space AR approximations, creates a fundamental experience quality stratification that undermines the universality of AR shopping as a mainstream commerce feature and limits its conversion impact to the subset of shoppers accessing it through devices whose hardware capabilities support the quality threshold needed for genuinely useful product evaluation. The consumer technical literacy dimension of AR shopping adoption presents a parallel accessibility challenge, as the gesture recognition, camera permission granting, physical space preparation, and device positioning behaviors required to initiate and maintain a useful AR furniture placement or virtual try-on experience involve a degree of user interface complexity and physical interaction effort that creates adoption friction particularly among older consumer demographics whose purchase power in furniture, home decor, and premium fashion categories is commercially significant but whose digital technology proficiency and patience with novel interaction paradigms is lower than the Gen Z early adopter population for whom AR shopping was initially designed. The network dependency of cloud-rendered AR experiences in markets with inconsistent cellular connectivity, including rural areas of North America, emerging market urban environments with congested 4G networks, and international travel contexts where data roaming costs constrain mobile data usage, creates performance degradation scenarios in which AR product loading times, rendering frame rates, and tracking stability fall below the consumer experience quality threshold needed to support purchase decision confidence, generating negative brand associations that reduce the net commercial benefit of AR shopping feature investment for retailers whose consumer base extends beyond high-connectivity metropolitan market segments.
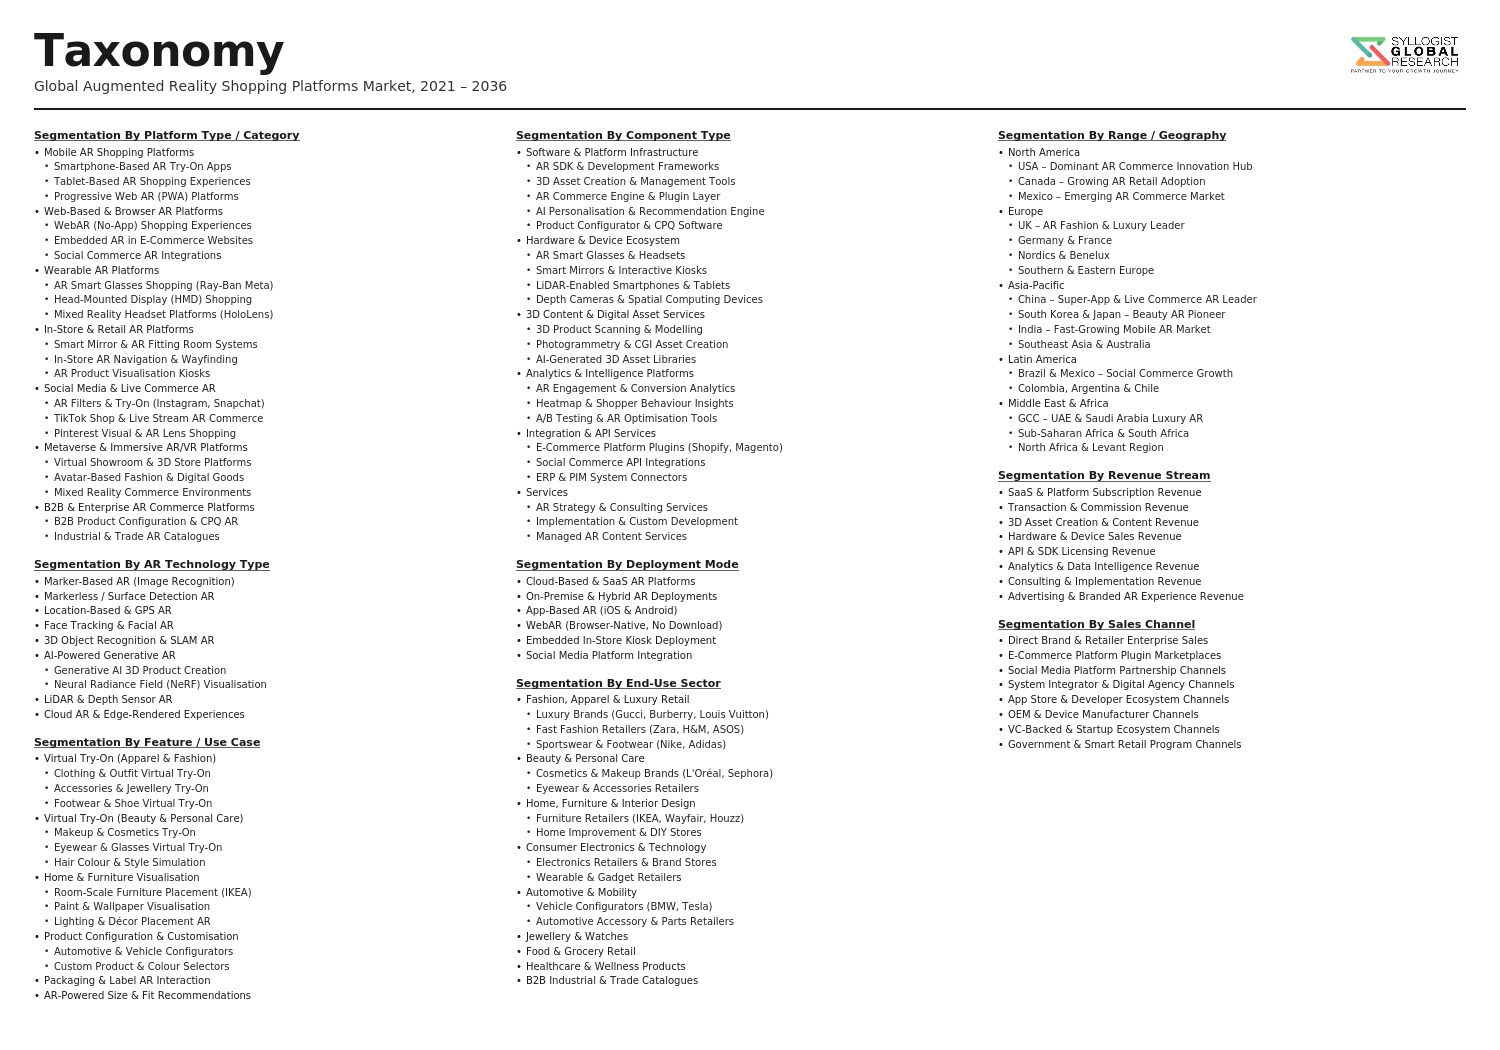
Market Segmentation
- Segmentation By Technology Type
- Markerless AR and SLAM-Based Product Placement
- Face-Tracking and Facial Recognition Virtual Try-On
- Body Tracking and Pose Estimation for Apparel Try-On
- LiDAR and Depth Sensor-Enhanced Spatial AR
- WebAR and Browser-Native Augmented Reality (WebXR)
- AI-Powered 3D Product Asset Generation and Rendering
- Mixed Reality and Spatial Computing (AR Headset-Based)
- Others
- Segmentation By Application
- Furniture and Home Decor Room Visualization
- Beauty and Cosmetics Virtual Try-On
- Apparel and Fashion Virtual Try-On
- Footwear and Accessories Virtual Try-On
- Eyewear and Optical Virtual Try-On
- Jewelry and Watches Virtual Try-On
- Consumer Electronics and Appliance Spatial Visualization
- Home Improvement and DIY Product Visualization
- Automotive Interior and Exterior AR Configuration
- Others
- Segmentation By Platform
- Mobile Application (iOS and Android Native AR)
- Web-Based AR (Browser-Native WebAR and WebXR)
- Social Media AR (Snap, TikTok, Instagram, Pinterest)
- In-Store AR Kiosk and Digital Mirror
- AR Headset and Wearable Spatial Commerce
- Voice-Activated and Smart Display AR Commerce
- Others
- Segmentation By Retail Channel
- E-Commerce and D2C Online Retail
- Omnichannel Retail (Integrated Online and In-Store)
- Social Commerce and Shoppable Content Platforms
- In-Store and Physical Retail AR Enhancement
- Live Commerce and Interactive Shopping Streams
- Others
- Segmentation By End-Use Industry
- Fashion and Apparel Retail
- Beauty, Cosmetics, and Personal Care
- Furniture, Home Decor, and Interior Design
- Consumer Electronics and Technology
- Footwear and Accessories
- Jewelry, Watches, and Luxury Goods
- Automotive and Mobility
- Home Improvement and Building Materials
- Others
- Segmentation By Business Model
- AR Platform Software-as-a-Service (SaaS) Licensing
- AR Advertising and Sponsored Try-On Revenue
- Managed Service and AR Content Production
- Performance-Based and Commission Revenue Models
- Enterprise Platform Integration and API Monetization
- Others
- Segmentation By Region
- North America
- Europe
- Asia-Pacific
- Latin America
- Middle East and Africa
All market revenues are presented in USD
Historical Year: 2021-2024 | Base Year: 2025 | Estimated Year: 2026 | Forecast Period: 2027-2034
Key Questions this Study Will Answer
- What is the total global market valuation of the Augmented Reality Shopping Platforms Market in the base year 2025, and what is the projected market size and compound annual growth rate through 2034, disaggregated by technology type, application, platform, retail channel, end-use industry, and region, to enable AR technology developers, retail brands, e-commerce platform operators, social media companies, and investors to identify which AR shopping categories and geographic markets will generate the highest absolute revenue and the most commercially defensible adoption growth across the forecast period?
- What is the documented and independently verified commercial impact of AR shopping platform deployment across furniture, beauty, apparel, footwear, and eyewear retail categories in terms of conversion rate improvement, average order value increase, product return rate reduction, and consumer engagement depth metrics, and how do these performance outcomes vary by AR technology modality, product category, consumer demographic, device type, and retail channel integration model across the major geographic markets where AR shopping programs have achieved sufficient deployment scale to generate statistically meaningful performance data?
- How is the competitive landscape of 3D product asset creation and management evolving as AI-powered automated 3D modeling tools from Luma AI, Stability AI, and platform-native generation tools progressively reduce per-SKU asset production costs, and what quality, consistency, and production throughput benchmarks must AI-generated 3D assets achieve to displace professional 3D modeling workflows for premium brand AR program deployments, and how does the democratization of 3D asset production reshape the competitive dynamics between large enterprise retailers with established 3D content infrastructure and mid-market retailers previously excluded by asset production cost barriers?
- How are the biometric data privacy compliance obligations under GDPR, the Illinois Biometric Information Privacy Act, CCPA, and equivalent frameworks in Canada, Australia, Brazil, and Asia shaping the technical architecture, consent management design, and geographic deployment strategies of facial recognition-based beauty try-on and body measurement-based apparel try-on platforms, which on-device processing versus cloud processing technology approaches are emerging as the preferred compliance architecture for global AR shopping platform deployments, and what regulatory developments in biometric data legislation across major markets are expected to further constrain or reshape AR try-on feature deployment through 2034?
- Who are the leading AR shopping platform technology providers including Perfect Corp, Snap AR, Vertebrae, Zakeke, Marxent, Threekit, and spatial computing platform developers, major retailer-operated AR program deployments from IKEA, Wayfair, Sephora, and Amazon, and social commerce platform AR integrations from TikTok, Instagram, and Pinterest currently defining the competitive and commercial landscape of the global augmented reality shopping platforms market, and what are their respective technology capabilities across facial tracking, body simulation, spatial mapping, and WebAR modalities, retailer and brand customer portfolios, 3D content production ecosystem partnerships, social platform distribution reach, and strategic roadmap investments in generative AI product visualization and spatial computing commerce toward the forecast period?
- Product Definition
- Research Methodology
- Research Design & Framework
- Overall Research Approach: Descriptive, Exploratory & Quantitative Mixed-Method Design
- Market Definition & Scope Boundaries: What is Included and Excluded
- Segmentation Framework
- Key Research Assumptions & Limitations
- Secondary Research
- Primary Research Design & Execution
- Data Triangulation & Validation
- Market Sizing & Forecasting Methodology
- Competitive Intelligence Methodology
- Quality Assurance & Peer Review
- Definitions, Abbreviations & Data Notes
- Research Design & Framework
- Executive Summary
- Market Snapshot & Headline Numbers
- Key Findings & Research Highlights
- Market Dynamics
- Regional Market Summary
- Competitive Landscape Snapshot
- Technology & Innovation Highlights
- Market Dynamics
- Drivers
- Restraints
- Opportunities
- Challenges
- Porter’s Five Forces Analysis
- PESTLE Analysis
- Market Trends & Developments
- Emerging Trends
- Technological Developments
- Regulatory & Policy Changes
- Supply Chain & Sourcing Trends
- Manufacturing & Process Trends
- Investment & Funding Activity
- Sustainability & ESG Trends
- Risk Assessment Framework
- Device Fragmentation, Hardware Dependency & Uneven AR-Capable Smartphone Penetration Risk Across Markets
- 3D Asset Creation Cost, Content Quality Inconsistency & Retailer Technology Readiness Barrier Risk
- Data Privacy, GDPR & Biometric Data Regulation Risk from AR Try-On & Facial Recognition Features
- Consumer Trust, Perceived Accuracy & Return Rate Impact Risk if AR Visualisation Diverges from Physical Product
- Competitive Disruption from Generative AI Visual Commerce, VR & Metaverse Commerce Substitution Risk
- Regulatory Framework & Standards
- GDPR, CCPA & Biometric Privacy Laws (BIPA) Governing AR Try-On, Facial Mapping & Consumer Data Collection on Shopping Platforms
- EU AI Act & Algorithmic Transparency Requirements Applicable to AI-Powered AR Product Recommendation & Personalisation
- Consumer Protection & Advertising Standards: FTC Guidelines, ASA Rules & Distance Selling Regulations for AR-Enhanced Product Claims
- Accessibility Standards (WCAG, ADA & EN 301 549) & Inclusive Design Requirements for AR Shopping Platform Interfaces
- Intellectual Property, 3D Asset Copyright & Digital Twin Licensing Frameworks for AR Product Visualisation Content
- Global Augmented Reality Shopping Platforms Market Outlook
- Market Size & Forecast by Value
- Market Size & Forecast by Platform Type
- Standalone AR Shopping Apps (Retailer & Brand-Owned AR Applications)
- E-Commerce Platform-Integrated AR Modules (Shopify, Magento & Custom Integration)
- Social Commerce AR Shopping Platforms (Instagram, Snapchat, TikTok & Pinterest AR)
- In-Store & Phygital AR Shopping Platforms (Smart Mirror, AR Kiosk & In-Store AR Overlay)
- Marketplace-Integrated AR Shopping Platforms (Amazon, Alibaba & Flipkart AR)
- B2B AR Product Catalogue & Sales Enablement Platforms
- WebAR & Browser-Based AR Shopping Platforms (No-App Required)
- Metaverse & Spatial Commerce AR Shopping Environments
- Market Size & Forecast by AR Technology
- Marker-Based AR (Image & QR Code Triggered Product Visualisation)
- Markerless AR (Surface Detection, SLAM & LiDAR-Based Product Placement)
- Face Tracking & Facial AR (Virtual Try-On for Beauty, Eyewear & Accessories)
- Body Tracking & Full-Body AR (Virtual Try-On for Apparel & Footwear)
- 3D Object Recognition & Scene Understanding AR
- WebAR & Browser-Based AR (8th Wall, Model Viewer & AR.js)
- Wearable AR (Smart Glasses, AR Headset & Mixed Reality Commerce)
- Market Size & Forecast by Product Category
- Fashion, Apparel & Footwear
- Beauty, Cosmetics & Personal Care
- Eyewear, Jewellery & Accessories
- Furniture, Home Decor & Interior Design
- Consumer Electronics & Gadgets
- Automotive & Mobility
- Sporting Goods, Fitness & Outdoor Equipment
- Food, Grocery & Packaged Consumer Goods
- Market Size & Forecast by Deployment Channel
- Mobile App (iOS & Android Native AR)
- Web Browser (WebAR & No-Download AR)
- Social Media Platform (Snapchat, Instagram, TikTok & Pinterest Lens)
- In-Store Digital Screen & Smart Mirror
- Wearable Device (AR Glasses & HMD)
- Voice & Conversational AI-Integrated AR
- Market Size & Forecast by Monetisation Model
- SaaS Platform Subscription & Licence Fee
- Per-SKU & 3D Asset Creation & Hosting Fee
- Revenue Share & Commission on AR-Assisted Transaction
- Advertising & Sponsored AR Experience Fee
- Enterprise Licence & Custom Integration Contract
- Freemium & Usage-Based API Pricing
- Market Size & Forecast by End-User
- Fashion & Apparel Retailers & Brands
- Beauty & Personal Care Brands & Retailers
- Home Furnishing & Interior Design Retailers
- Consumer Electronics Retailers & OEMs
- E-Commerce Marketplaces & Pure-Play Online Retailers
- Physical Retailers & Department Stores Adopting Phygital Experiences
- D2C Brands & Emerging Digital-Native Retailers
- North America Augmented Reality Shopping Platforms Market Outlook
- Market Size & Forecast
- By Value
- By Platform Type
- By AR Technology
- By Product Category
- By Deployment Channel
- By End-User
- By Country
- By Monetisation Model
- Market Size & Forecast
- Europe Augmented Reality Shopping Platforms Market Outlook
- Market Size & Forecast
- By Value
- By Platform Type
- By AR Technology
- By Product Category
- By Deployment Channel
- By End-User
- By Country
- By Monetisation Model
- Market Size & Forecast
- Asia-Pacific Augmented Reality Shopping Platforms Market Outlook
- Market Size & Forecast
- By Value
- By Platform Type
- By AR Technology
- By Product Category
- By Deployment Channel
- By End-User
- By Country
- By Monetisation Model
- Market Size & Forecast
- Latin America Augmented Reality Shopping Platforms Market Outlook
- Market Size & Forecast
- By Value
- By Platform Type
- By AR Technology
- By Product Category
- By Deployment Channel
- By End-User
- By Country
- By Monetisation Model
- Market Size & Forecast
- Middle East & Africa Augmented Reality Shopping Platforms Market Outlook
- Market Size & Forecast
- By Value
- By Platform Type
- By AR Technology
- By Product Category
- By Deployment Channel
- By End-User
- By Country
- By Monetisation Model
- Market Size & Forecast
- Country-Wise* Augmented Reality Shopping Platforms Market Outlook
- Market Size & Forecast
- By Value
- By Platform Type
- By AR Technology
- By Product Category
- By Deployment Channel
- By End-User
- By Country
- By Monetisation Model
- Market Size & Forecast
- *Countries Analyzed in the Syllogist Global Research Portfolio: United States, Canada, Mexico, Germany, France, United Kingdom, Netherlands, Spain, Italy, Norway, Sweden, China, Japan, India, Australia, South Korea, Singapore, Brazil, Chile, Saudi Arabia, UAE, Egypt, South Africa, Israel
- Technology Landscape & Innovation Analysis
- Computer Vision, SLAM & LiDAR-Based Spatial Mapping Technology Deep-Dive for Accurate AR Product Placement in Retail Environments
- 3D Asset Creation, Photogrammetry, NeRF & AI-Generated 3D Model Technology for Scalable AR Product Catalogue Production
- Face Tracking & Skin Tone Analysis Technology for Beauty & Cosmetics Virtual Try-On Accuracy & Personalisation
- Full-Body Pose Estimation & Garment Simulation Technology for Fashion & Apparel AR Virtual Try-On
- WebAR Engine Technology: 8th Wall, Zappar, Niantic Lightship & Browser-Based AR Performance Optimisation
- Generative AI & Large Multimodal Model Integration for Personalised AR Shopping, Style Recommendation & Virtual Styling
- Spatial Computing & Wearable AR Commerce Technology: Apple Vision Pro, Meta Orion & Smart Glasses Shopping Experience
- Patent & IP Landscape in Augmented Reality Shopping Platform Technologies
- Value Chain & Supply Chain Analysis
- AR SDK, Computer Vision Engine & Spatial Computing Infrastructure Supply Chain
- 3D Asset Creation Studio, Photogrammetry Service & AI Model Generation Supply Chain
- AR Platform Software Development, Cloud Hosting & CDN Delivery Supply Chain
- E-Commerce Platform Integration, API Development & System Integration Supply Chain
- Retailer & Brand Onboarding, SKU Digitisation & AR Content Management Supply Chain
- Digital Marketing, Social Commerce & AR Experience Distribution Channel
- Consumer Data Analytics, Behavioural Insight & Personalisation Engine Value Chain
- Pricing Analysis
- AR Platform SaaS Subscription Fee Benchmarking by Tier, SKU Volume & Feature Set
- 3D Asset & Digital Twin Creation Cost per SKU: Photogrammetry, Manual 3D Modelling & AI Generation Comparison
- WebAR vs. Native App AR Deployment Cost & Performance Trade-Off Analysis
- Social Commerce AR Lens & Sponsored AR Experience Cost per Engagement & ROAS Analysis
- Enterprise AR Platform Licence & Custom Integration Project Cost Analysis
- Total AR Shopping Platform Cost of Ownership per Retailer vs. Conversion Uplift & Return Rate Reduction ROI Analysis
- Sustainability & Environmental Analysis
- AR Shopping Platforms & Return Rate Reduction: Carbon Footprint & Logistics Emission Savings from Improved Purchase Confidence
- Digital Product Visualisation vs. Physical Sampling: Material Waste, Sample Production & Showroom Footprint Reduction Benefits
- Energy Consumption of AR Cloud Infrastructure, 3D Asset Rendering & Edge Computing: Carbon Footprint Analysis
- Sustainable Fashion & Conscious Consumption: AR Try-On Role in Reducing Impulse Purchase, Overproduction & Textile Waste
- Regulatory-Driven Sustainability, SDG 12 (Responsible Consumption), SDG 13 (Climate Action) & ESG Disclosure Alignment for AR Platform Operators
- Competitive Landscape
- Market Structure & Concentration
- Market Consolidation Level (Fragmented vs. Consolidated by Platform Type & Geography)
- Top 10 Players Market Share
- HHI (Herfindahl-Hirschman Index) Concentration Analysis
- Competitive Intensity Map by Platform Type, AR Technology & Product Category
- Player Classification
- Integrated AR Commerce Platform & SaaS Providers
- Social Media Platforms with Embedded AR Shopping Capabilities
- E-Commerce Platform Vendors with Native AR Module Integration
- Specialist Beauty & Fashion Virtual Try-On Technology Providers
- Furniture & Home Decor AR Visualisation Platform Specialists
- WebAR Engine & Browser-Based AR Technology Providers
- 3D Asset Creation, Digital Twin & Photogrammetry Service Providers
- Wearable AR & Spatial Computing Commerce Platform Developers
- Competitive Analysis Frameworks
- Market Share Analysis by Platform Type, AR Technology & Region
- Company Profile
- Company Overview & Headquarters
- AR Shopping Platform Products, Modules & Technology Portfolio
- Key Retailer & Brand Customer Relationships & Reference Deployments
- Number of Active SKUs, Monthly Active Users & Platform GMV
- Revenue (AR Shopping Platform Segment) & Growth Trajectory
- Technology Differentiators & IP
- Key Strategic Partnerships, JVs & M&A Activity
- Recent Developments (Platform Launches, Feature Releases, Retail Partnerships)
- SWOT Analysis
- Strategic Focus Areas & Roadmap
- Competitive Positioning Map (AR Technology Capability vs. Retail Vertical Depth)
- Key Company Profiles
- Market Structure & Concentration
- Strategic Opportunity Analysis
- Strategic Output
- Market Opportunity Matrix: By Platform Type, AR Technology, Product Category, Deployment Channel, End-User & Geography
- White Space Opportunity Analysis
- Strategic Recommendations
- Product Portfolio & Technology Investment Strategy
- Manufacturing & Operational Excellence Strategy
- Geographic Expansion & Localisation Strategy
- Customer & End-User Engagement Strategy
- Partnership, M&A & Ecosystem Strategy
- Sustainability & Circular Economy Strategy
- Risk Mitigation & Future Roadmap
- Strategic Priority Matrix & Roadmap
- Near-term (2025-2028)
- Mid-term (2029-2032)
- Long-term (2033-2037)
- Strategic Output