Global Corporate Renewable PPA Market By Contract Structure, By Technology, By Contract Tenor, By Buyer Profile, By End User Industry, By Delivery Profile, By Region, Competition, Forecast & Opportunities, 2021-2036F
Market Definition
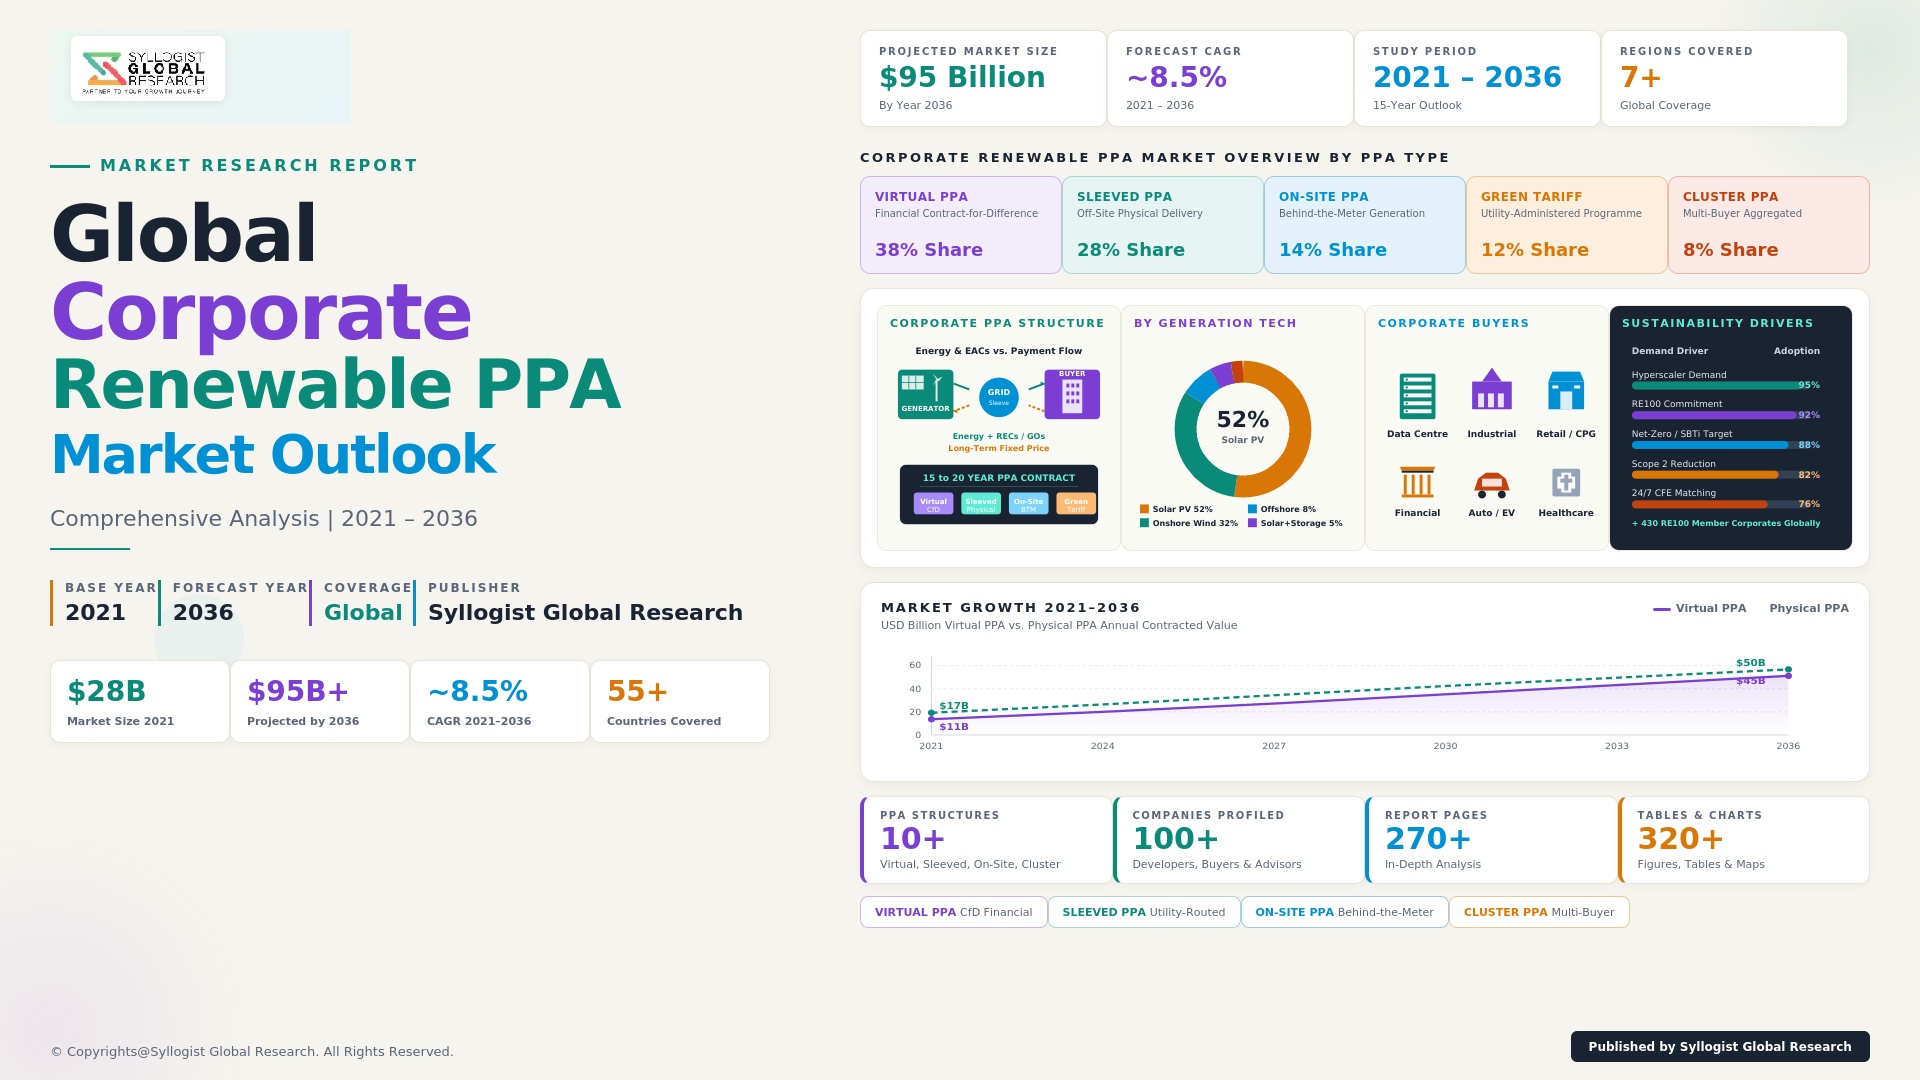
The Global Corporate Renewable PPA Market covers the contracting, structuring, execution, and management of long-term power purchase agreements between corporate energy buyers and renewable power producers, in which the buyer commits to procure electricity, environmental attributes, or both from designated solar PV, onshore wind, offshore wind, hydro, geothermal, or battery-hybridized renewable assets over fixed contract tenors typically spanning 7 to 20 years. The market includes physical PPAs in which the corporate buyer takes title to electricity at a defined delivery point on the wholesale grid; virtual or financial PPAs structured as contracts for difference that settle the spread between the strike price and the floating wholesale price without physical delivery; sleeved PPAs intermediated by a licensed utility or supplier; on-site and behind-the-meter PPAs where the renewable asset is located on or adjacent to the buyer’s premises; aggregated multi-buyer PPAs that pool demand across mid-sized corporates and SMEs; and proxy revenue swaps and renewable-as-a-service constructs that transfer specific risk components to financial counterparties. Within scope are the price discovery, contract negotiation, settlement, hedging, balancing, accounting, and renewable energy certificate, guarantee of origin, and I-REC tracking workflows that surround a PPA, along with the technology platforms and advisory services that support buyer-side procurement teams. End-buyers span hyperscale data center operators, technology platforms, manufacturers, retailers, consumer goods companies, telecoms, financial institutions, and industrial users with multi-site electricity portfolios. For this study, the market is measured by contracted MW capacity, contracted MWh volume, and the underlying USD economic value of PPA flows across investment-grade and non-investment-grade off-takers.
Market Insights
The global corporate renewable PPA market has matured from a US tech-led procurement experiment into a globalized energy strategy lever that shapes both corporate electricity spend and the bankability of new renewable capacity. Cumulative contracted capacity through corporate PPAs reached approximately 196 GW by the end of 2024, with new annual contracting volume of 47.6 GW signed in 2024 and projected to cross 62 GW in 2025. The market is on a compound annual growth trajectory of 18.4% through 2032, supported by Scope 2 emissions accounting under the GHG Protocol’s market-based method, accelerating internal carbon pricing adoption, and the strategic imperative to lock in electricity price visibility against grid tariff volatility. Solar PV-anchored PPAs account for 54% of contracted capacity, onshore wind for 33%, offshore wind for 9%, and hybrid solar-plus-storage and standalone storage tolls for the remaining 4%.
Hyperscale data center operators and the broader technology sector remain the single largest off-taker cohort, accounting for 38% of all corporate PPA capacity contracted in 2024. The five largest corporate buyers, namely Amazon, Microsoft, Meta, Google, and Apple, collectively contracted 28.4 GW of renewable capacity in 2024, equivalent to the entire annual US solar installation footprint for the year. AI workload growth has emerged as a structural demand vector, with hyperscalers signing record long-tenor PPAs to secure carbon-free electricity ahead of accelerating power demand from training and inference fleets. The average tenor of new technology-sector PPAs extended to 14.7 years in 2024, up from 11.2 years in 2021, reflecting both buyer appetite for price certainty and developer demand for bankable revenue across a 25-year asset life.
Geographic expansion is reshaping the market beyond its US and Nordic roots. The United States retains 41% of global cumulative contracted capacity, but Europe is closing the gap rapidly, with Spain, Germany, the United Kingdom, and Italy collectively contracting 19.8 GW in 2024. The Asia Pacific market has tripled since 2022, with India, Australia, Japan, and Taiwan emerging as the leading contracting jurisdictions, supported by green tariff reforms, third-party access rules, and corporate sustainability mandates. Latin America and the Middle East are accelerating, with Chile, Brazil, the UAE, and Saudi Arabia hosting first-of-kind multi-buyer PPA structures. Aggregated and consortium PPAs are becoming the fastest-growing structural format, expanding from 4% of new contracts in 2021 to 14% in 2024, as mid-sized corporates pool demand to access wholesale-priced renewable supply that was historically inaccessible to buyers consuming under 50 GWh per year.
PPA pricing has experienced material volatility over the last three years, with weighted-average European solar PPA prices peaking near EUR 79 per MWh in late 2022, then falling to EUR 62 per MWh by Q4 2024 as new capacity entered the market. US solar PPA prices averaged USD 41 per MWh in 2024, with wind PPA prices at USD 38 per MWh, both reflecting interconnection delays, transformer supply constraints, and basis risk repricing. Hybrid PPAs combining solar with battery storage have emerged as the fastest-growing structural innovation, capturing 11% of new contract value in 2024, while traditional pay-as-produced PPAs are giving way to baseload-shaped and 24/7 carbon-free energy PPAs that match buyer consumption hour by hour. Risk-sharing innovations including merchant tail coverage, proxy revenue swaps, weather-indexed settlement adjustments, and shape risk hedges are increasingly bundled into multi-party PPA architectures to balance developer and corporate risk appetites.
Key Drivers
Corporate Net-Zero Commitments, Scope 2 Decarbonization Mandates, and Investor ESG Disclosure Requirements Driving Long-Tenor Renewable Procurement Programs
Accelerating adoption of science-based emissions targets validated by the SBTi framework, reinforced by mandatory climate disclosure regimes including the EU CSRD, SEC climate disclosure rules, and the ISSB standards, is converting renewable procurement from a discretionary sustainability initiative into a board-level operational requirement. Over 7,800 companies have validated SBTi targets as of 2024, with approximately 4,200 of those requiring physical or virtual PPA execution to achieve Scope 2 reduction commitments, generating durable multi-decade contracting demand that is materially resistant to commodity price cycles.
AI-Led Hyperscale Data Center Power Demand and Long-Duration Clean Electricity Procurement Imperatives Reshaping Buyer Risk Appetite
The acceleration of AI training and inference workloads is driving unprecedented growth in hyperscale data center power demand, with global data center electricity consumption forecast to exceed 1,000 TWh by 2026, requiring 24/7 carbon-free electricity sourcing to maintain credible clean energy claims. Hyperscalers signed 28.4 GW of corporate PPAs in 2024 with average tenors of 14.7 years, and are now committing to multi-decade nuclear, geothermal, and round-the-clock renewable PPAs that fundamentally reshape the credit, structuring, and price-discovery characteristics of the broader market.
Grid Tariff Volatility, Industrial Power Cost Exposure, and Strategic Hedging Imperatives Among Manufacturing and Heavy Industrial Off-Takers
The structural rise in industrial electricity tariffs, exacerbated by the 2022 European energy crisis, accelerated grid charge inflation in the US and India, and the rising cost of carbon allowances under the EU ETS and emerging Asian carbon markets, has converted long-tenor PPAs from a sustainability tool into a strategic hedge for manufacturing, refining, chemicals, and heavy industrial buyers. Fixed-price PPA tenors of 10 to 15 years deliver power price visibility against tariff volatility that conventional retail supply contracts cannot replicate, anchoring contracting demand even among non-sustainability-driven buyers.
Key Challenges
Grid Congestion, Interconnection Delays, and Curtailment Risk Eroding Contracted PPA Energy Delivery and Settlement Economics
The interconnection queue across the United States exceeds 2,600 GW with average wait times stretching beyond 4 years, while Europe, India, and Australia confront similar transmission constraints that delay PPA project COD and expose buyers to settlement gaps. Localized curtailment of solar and wind projects has reached 11% on average in congested regions of Texas, California, Spain, and Australia, eroding contracted energy delivery, compressing developer revenue stacks, and complicating the pay-as-produced PPA economics that underpin most of the market.
PPA Pricing Volatility, Merchant Tail Risk, and Diverging Buyer-Developer Risk Appetite Slowing Contract Execution Pipelines
PPA price discovery has been disrupted by sustained interconnection delays, transformer and inverter cost inflation, rising risk-free rates, and basis risk repricing, with European solar PPA strike prices varying widely across jurisdictions in 2024 at an average of EUR 62 per MWh. Developers facing 25-year asset lives but contracting tenors of 10 to 15 years confront material merchant tail exposure that drives strike price uplift, while corporate buyers prioritize cost certainty over revenue stack complexity, slowing execution pipelines and elongating negotiation timelines.
Regulatory Heterogeneity, Limited Third-Party Access, and Inconsistent Renewable Energy Certificate Recognition Across Jurisdictions
Material differences in PPA enabling regulation across the United States, the European Union, India, Japan, and emerging markets create execution friction for multinational corporate buyers seeking to standardize procurement frameworks. Constraints include restrictions on third-party access to the wholesale grid in South Korea, Indonesia, and parts of the Middle East, varying treatment of guarantees of origin and I-RECs under the GHG Protocol, and inconsistent cross-border REC recognition, all of which complicate portfolio-level PPA architectures and force buyers to maintain country-specific contracting playbooks.
Market Segmentation
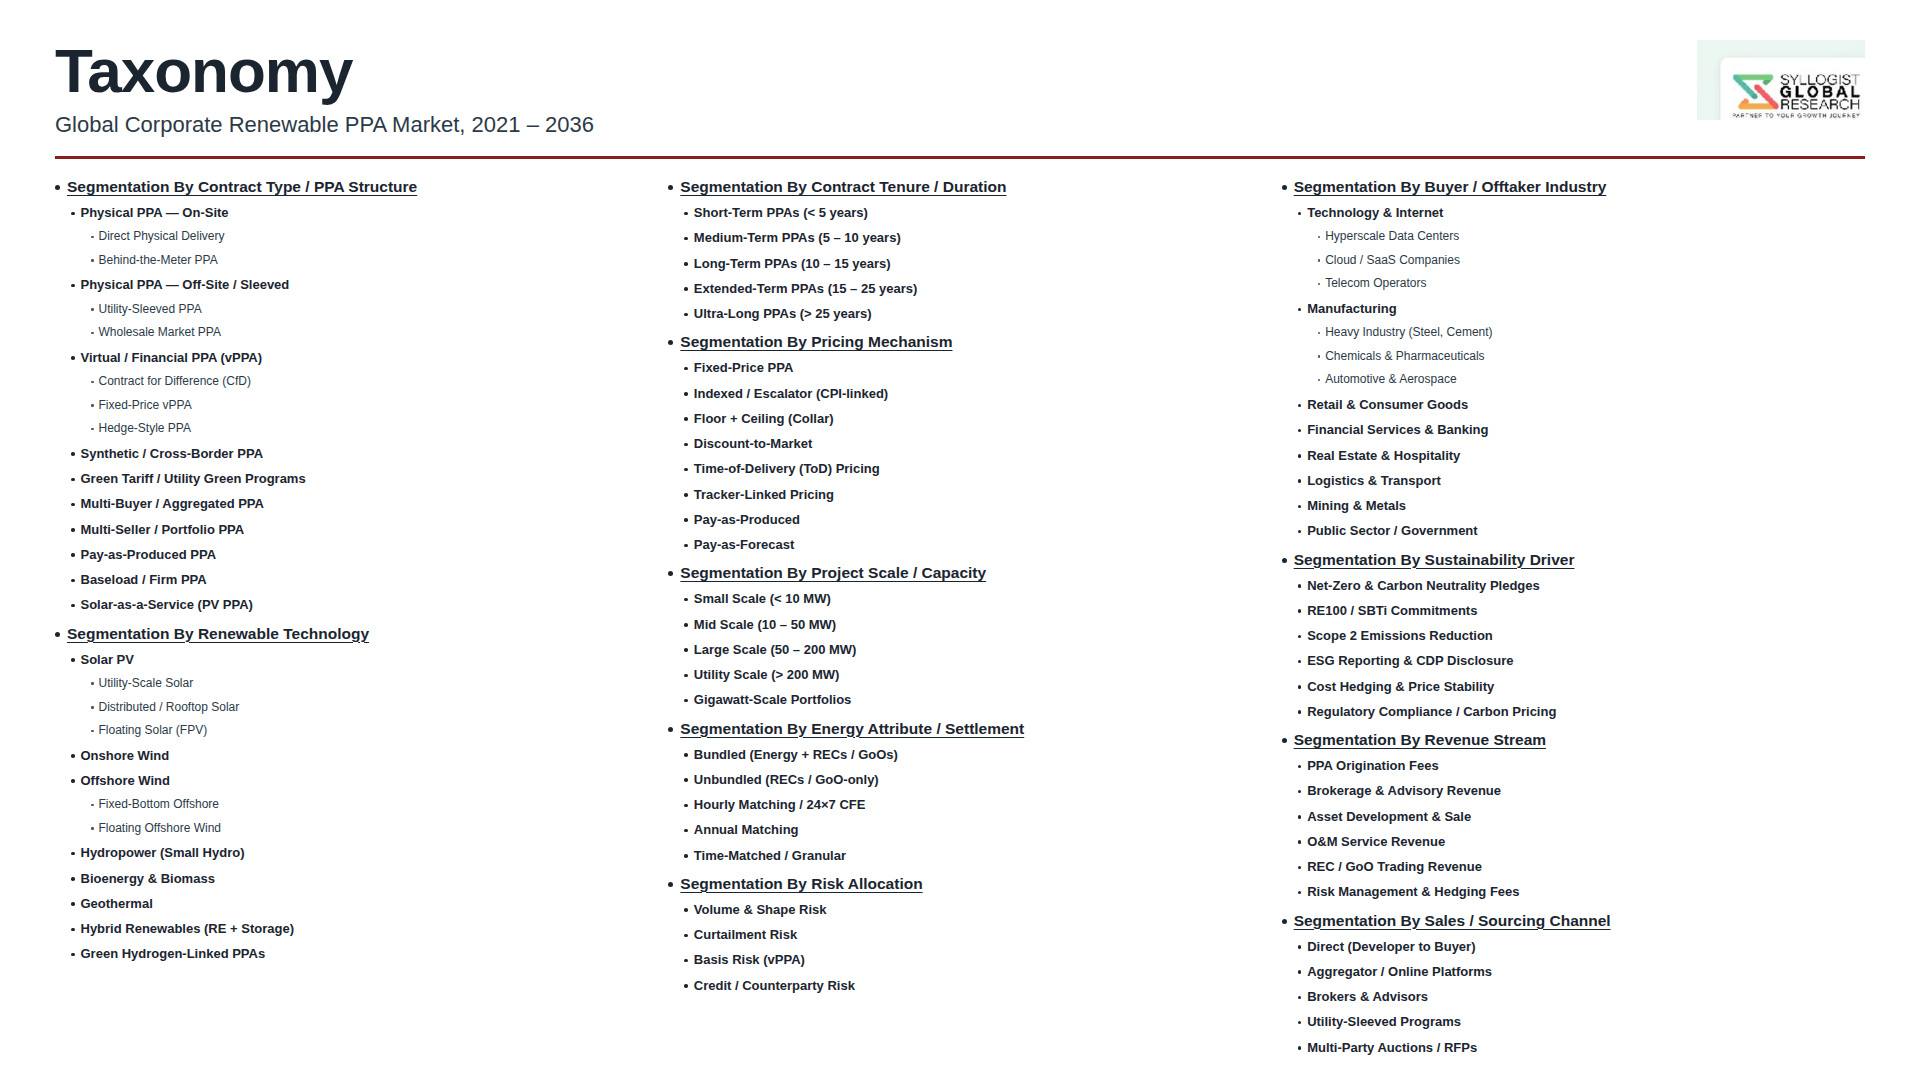
- Segmentation By Contract Structure
- Physical PPA
- Virtual or Financial PPA (Contracts for Difference)
- Sleeved PPA
- On-Site and Behind-the-Meter PPA
- Aggregated and Multi-Buyer PPA
- Proxy Revenue Swap and Renewable-as-a-Service
- Others
- Segmentation By Technology
- Solar PV
- Onshore Wind
- Offshore Wind
- Hybrid Solar-plus-Storage
- Standalone Battery Storage
- Hydro and Geothermal
- Others
- Segmentation By Contract Tenor
- Up to 5 Years
- 5 to 10 Years
- 10 to 15 Years
- 15 to 20 Years
- Above 20 Years
- Segmentation By Buyer Profile
- Investment-Grade Corporate
- Non-Investment-Grade Corporate
- Public Sector and Government
- SME and Aggregated Off-Takers
- Others
- Segmentation By End User Industry
- Technology and Hyperscale Data Centers
- Manufacturing and Industrial
- Retail and Consumer Goods
- Financial Services and Insurance
- Telecom and Media
- Heavy Industry, Chemicals, and Refining
- Healthcare and Pharmaceuticals
- Real Estate and Hospitality
- Others
- Segmentation By Delivery Profile
- Pay-as-Produced
- Baseload-Shaped
- 24/7 Carbon-Free Energy
- Others
- Segmentation By Region
- North America
- Europe
- Asia-Pacific
- Middle East and Africa
- Latin America
All market revenues are presented in USD
Historical Year: 2021-2024 | Base Year: 2025 | Estimated Year: 2026 | Forecast Period: 2027-2034
Key Questions this Study Will Answer
- What is the total contracted capacity, MWh volume, and underlying USD economic value of the Global Corporate Renewable PPA Market in 2025, projected through 2034, disaggregated by contract structure, technology, and buyer industry, enabling developers, off-takers, financiers, and advisory firms to identify the highest-growth segments and most durable contracting opportunities across the corporate PPA landscape?
- How are leading corporate buyers in the United States, the European Union, the United Kingdom, India, Australia, Japan, and emerging markets allocating procurement across physical PPAs, virtual PPAs, sleeved PPAs, and aggregated PPA structures, and which national regulatory frameworks are setting the procurement benchmarks shaping the global corporate PPA market through 2034?
- What are the relative pricing, tenor, risk allocation, and bankability characteristics of solar PV, onshore wind, offshore wind, hybrid solar-plus-storage, and 24/7 carbon-free energy PPAs across major jurisdictions, and which technology and delivery profile combinations are most likely to capture incremental share between 2025 and 2034?
- Which buyer cohorts, including hyperscale data centers, manufacturing, retail, financial services, telecom, heavy industry, and SME-aggregated platforms, are generating the highest contracting velocity through 2034, and what credit, structuring, hedging, and accounting frameworks are most critical to converting corporate net-zero commitments into executed PPA volume?
- How is the competitive landscape structured among independent power producers, utility-affiliated developers, PPA aggregators, financial PPA intermediaries, advisory platforms, and emerging digital PPA marketplaces, and what partnership, financing, and platformization strategies are enabling new entrants to compete with established renewable developers in next-generation corporate PPA programs?
- What are the most significant interconnection, curtailment, basis risk, merchant tail, regulatory heterogeneity, and counterparty credit risks affecting corporate PPA deployments in operational service, and how are buyers, developers, and financial counterparties addressing risk allocation, hedging, and settlement architecture within evolving PPA contract frameworks?
- Which regional corporate PPA markets, specifically North America, Europe, Asia Pacific, Latin America, and the Middle East and Africa, are expected to generate the most substantial incremental contracted capacity through 2034, and what regulatory reforms, third-party access rules, REC and guarantee of origin frameworks, and industrial decarbonization mandates are driving buyer preferences and developer market entry in each regional market?
- Product Definition
- Research Methodology
- Research Design & Framework
- Overall Research Approach: Descriptive, Exploratory & Quantitative Mixed-Method Design
- Market Definition & Scope Boundaries: What is Included and Excluded
- Segmentation Framework
- Key Research Assumptions & Limitations
- Secondary Research
- Primary Research Design & Execution
- Data Triangulation & Validation
- Market Sizing & Forecasting Methodology
- Competitive Intelligence Methodology
- Quality Assurance & Peer Review
- Definitions, Abbreviations & Data Notes
- Research Design & Framework
- Executive Summary
- Market Snapshot & Headline Numbers
- Key Findings & Research Highlights
- Market Dynamics
- Regional Market Summary
- Competitive Landscape Snapshot
- Technology & Innovation Highlights
- Market Dynamics
- Drivers
- Restraints
- Opportunities
- Challenges
- Porter’s Five Forces Analysis
- PESTLE Analysis
- Market Trends & Developments
- Emerging Trends
- Technological & Structuring Developments
- Regulatory & Policy Changes
- Origination, Sourcing & Cluster-Buying Trends
- Settlement, Matching & Granular Certificate Trends
- Investment, Project Pipeline & Funding Activity
- Sustainability & ESG Trends
- Risk Assessment Framework
- Counterparty Credit, Corporate Buyer Default & Long-Term Off-Take Reliability Risk
- Power Price Volatility, Renewable Cannibalisation, Negative Pricing & Basis Risk
- Regulatory, Tax Credit (IRA, EU Clean Industrial Deal) & Cross-Jurisdictional PPA Eligibility Risk
- Grid Interconnection Delay, Curtailment, Transmission Congestion & Project Delivery Risk
- Greenwashing, Additionality, Hourly Matching & ESG Disclosure Credibility Risk
- Regulatory Framework & Standards
- National Renewable Energy Targets, Corporate Sourcing Frameworks & Power Market Liberalisation Status Across Jurisdictions
- Energy Attribute Certificate Standards (REC, Guarantees of Origin / GO, I-REC, REGO), Tracking Registries & Cross-Border Trade
- GHG Protocol Scope 2 Market-Based Reporting, RE100 Technical Criteria & 24/7 Carbon-Free Energy (CFE) Matching Frameworks
- Tax Credit, Subsidy & Incentive Frameworks Affecting PPA Pricing (IRA 45Y, ITC, PTC, CfD, Auction & Contract-for-Difference Schemes)
- ESG Disclosure (TCFD, ISSB, CSRD), Additionality, Greenwashing & Sustainable Finance Disclosure Standards
- Global Corporate Renewable PPA Market Outlook
- Market Size & Forecast by Value
- Market Size & Forecast by Volume (Contracted Capacity in GW & Annual Contracted Energy in TWh)
- Market Size & Forecast by PPA Type & Contract Structure
- Physical On-Site & Behind-the-Meter PPA
- Physical Off-Site / Sleeved PPA
- Virtual / Synthetic PPA (Contract-for-Difference Financial Structure)
- Utility-Administered Green Tariff & Green Power Programme
- Aggregated / Multi-Buyer & Cluster PPA
- Pre-Paid, Prepay Equity & Tax-Equity Structured PPA
- Market Size & Forecast by Generation Technology
- Utility-Scale Solar Photovoltaic (PV)
- Onshore Wind
- Offshore Wind
- Solar Plus Battery Energy Storage (Hybrid PPA)
- Standalone Battery Energy Storage Tolling PPA
- Hydropower (Large & Small)
- Geothermal, Biomass & Other Renewable Technologies
- Market Size & Forecast by Delivery & Settlement Profile
- Pay-as-Produced (PAP) Delivery Profile
- Baseload, Firm Shaped & 24/7 Annualised Matching
- 24/7 Hourly Matching & Carbon-Free Energy (CFE) Granular Settlement
- Solar Plus Storage Time-Shifted & Dispatchable Profile
- Indexed, Fixed, Collar & Hedged Settlement Structures
- Market Size & Forecast by Contract Size
- Mega-Scale Contracts (Above 500 MW)
- Large-Scale Contracts (100 to 500 MW)
- Mid-Scale Contracts (10 to 100 MW)
- Small-Scale & SME-Focused Contracts (Below 10 MW)
- Market Size & Forecast by Buyer Industry & Application
- Technology, Cloud & Hyperscale Data Centre Operators
- Industrial Manufacturing, Heavy Industry & Process Industries
- Retail, Consumer Goods & E-Commerce
- Financial Services, Banking & Insurance
- Healthcare, Pharmaceuticals & Life Sciences
- Telecommunications & Network Operators
- Automotive, EV & Battery Manufacturers
- Real Estate, Construction, Hospitality & Commercial Office Buildings
- Public Sector, Government & Educational Institutions
- Market Size & Forecast by End-User (Buyer Type)
- Single-Buyer Large Corporate (Fortune 500 / FTSE 100 / Equivalent)
- Multi-Buyer & Aggregated Corporate Cluster
- Mid-Cap & Mid-Market Corporate Buyers
- Small & Medium Enterprise (SME) Buyers
- Public Sector, Government & Sub-Sovereign Buyers
- Market Size & Forecast by Sales Channel
- Direct Bilateral Contract (Developer-to-Corporate Origination)
- Utility-Sleeved Supplier & Green Tariff Channel
- Multi-Buyer Aggregator & Cluster-Buying Platform Channel
- Specialist PPA Broker, Advisor & Origination Platform Channel
- North America Corporate Renewable PPA Market Outlook
- Market Size & Forecast
- By Value
- By Volume (Contracted Capacity in GW & Annual Contracted Energy in TWh)
- By PPA Type & Contract Structure
- By Generation Technology
- By Delivery & Settlement Profile
- By Contract Size
- By Buyer Industry & Application
- By End-User (Buyer Type)
- By Country
- By Sales Channel
- Europe Corporate Renewable PPA Market Outlook
- Market Size & Forecast
- By Value
- By Volume (Contracted Capacity in GW & Annual Contracted Energy in TWh)
- By PPA Type & Contract Structure
- By Generation Technology
- By Delivery & Settlement Profile
- By Contract Size
- By Buyer Industry & Application
- By End-User (Buyer Type)
- By Country
- By Sales Channel
- Asia-Pacific Corporate Renewable PPA Market Outlook
- Market Size & Forecast
- By Value
- By Volume (Contracted Capacity in GW & Annual Contracted Energy in TWh)
- By PPA Type & Contract Structure
- By Generation Technology
- By Delivery & Settlement Profile
- By Contract Size
- By Buyer Industry & Application
- By End-User (Buyer Type)
- By Country
- By Sales Channel
- Latin America Corporate Renewable PPA Market Outlook
- Market Size & Forecast
- By Value
- By Volume (Contracted Capacity in GW & Annual Contracted Energy in TWh)
- By PPA Type & Contract Structure
- By Generation Technology
- By Delivery & Settlement Profile
- By Contract Size
- By Buyer Industry & Application
- By End-User (Buyer Type)
- By Country
- By Sales Channel
- Middle East & Africa Corporate Renewable PPA Market Outlook
- Market Size & Forecast
- By Value
- By Volume (Contracted Capacity in GW & Annual Contracted Energy in TWh)
- By PPA Type & Contract Structure
- By Generation Technology
- By Delivery & Settlement Profile
- By Contract Size
- By Buyer Industry & Application
- By End-User (Buyer Type)
- By Country
- By Sales Channel
- Country-Wise* Corporate Renewable PPA Market Outlook
- Market Size & Forecast
- By Value
- By Volume (Contracted Capacity in GW & Annual Contracted Energy in TWh)
- By PPA Type & Contract Structure
- By Generation Technology
- By Delivery & Settlement Profile
- By Contract Size
- By Buyer Industry & Application
- By End-User (Buyer Type)
- By Country
- By Sales Channel
- *Countries Analyzed in the Syllogist Global Research Portfolio: United States, Canada, Mexico, Germany, France, United Kingdom, Netherlands, Spain, Italy, Norway, Sweden, China, Japan, India, Australia, South Korea, Singapore, Brazil, Chile, Saudi Arabia, UAE, Egypt, South Africa, Israel
- Technology Landscape & Innovation Analysis
- Physical On-Site & Behind-the-Meter PPA Structuring Deep-Dive
- Physical Off-Site / Sleeved PPA Structuring Through Utility & Retail Suppliers
- Virtual / Synthetic PPA (Contract-for-Difference) Financial Structuring & Settlement Mechanics
- 24/7 Hourly Matching, Time-Coincident Settlement & Granular Energy Attribute Certificate Technology
- Solar Plus Storage, Battery Tolling & Shaped Hybrid PPA Structuring
- Multi-Buyer, Aggregated & Cluster-Buying Platform Technology
- Energy Attribute Certificate Registries, Blockchain-Based Tracking & Granular Certificate Issuance
- Power Market Analytics, Forecasting, Hedging & PPA Settlement Software
- Patent & IP Landscape in PPA Structuring & Settlement Technologies
- Value Chain & Supply Chain Analysis
- Renewable Energy Developer & Independent Power Producer (IPP) Generator-Side Landscape
- Utility, Retail Electricity Supplier & Sleeving Counterparty Landscape
- Specialist PPA Advisor, Broker & Origination Platform Channel
- Multi-Buyer Aggregator, Cluster Platform & Pooled Procurement Channel
- Energy Attribute Certificate Registry, Tracking & Verification Service Providers
- Power Market Analytics, Forecasting, Hedging & Settlement Software Vendor Channel
- Legal, Tax, Structured Finance & Sustainability Advisory Service Providers
- Corporate Procurement, Treasury & Sustainability Function Buyer Channel
- Pricing Analysis
- PPA Price Benchmark by Generation Technology (Solar PV, Onshore Wind, Offshore Wind, Solar Plus Storage) & Region
- Pay-as-Produced vs. Baseload / Shaped vs. 24/7 Hourly Matching Pricing Premium Analysis
- Contract Tenor (5-Year, 10-Year, 15-Year, 20-Year & Above) & Price-Curve Implications
- Indexed, Fixed, Collar, Floor / Cap & Hybrid Pricing Structure Analysis
- Bundled vs. Unbundled Energy Attribute Certificate Pricing (REC, GO, I-REC, REGO) Analysis
- Levelised Cost of PPA Energy (LCOPE) & Total Cost of Procurement vs. Grid Tariff Benchmark Analysis
- Sustainability & Environmental Analysis
- Contribution of Corporate PPAs to Scope 2 Emission Reduction, RE100, SBTi & Corporate Net-Zero Targets
- Additionality, Geographic & Temporal Matching & Credibility of Renewable Procurement Claims
- 24/7 Carbon-Free Energy (CFE) Matching, Hourly Granularity & Decarbonisation of Residual Grid Emissions
- Lifecycle Carbon Footprint of Renewable Assets Behind PPAs & Embodied Emissions Disclosure
- Alignment with SDG 7 (Affordable & Clean Energy), SDG 13 (Climate Action) & Sustainable Finance Taxonomy Eligibility
- Competitive Landscape
- Market Structure & Concentration
- Market Consolidation Level (Fragmented vs. Consolidated by PPA Type & Geography)
- Top 10 Players Market Share
- HHI (Herfindahl-Hirschman Index) Concentration Analysis
- Competitive Intensity Map by PPA Type, Generation Technology & Geography
- Player Classification
- Integrated Global Renewable Developers & IPP PPA Sellers
- Utility, Retail Supplier & Sleeving Counterparties
- Specialist PPA Origination, Advisory & Brokerage Firms
- Sustainability Consulting & Corporate Procurement Advisors
- Multi-Buyer Aggregator & Cluster-Buying Platform Operators
- Energy Attribute Certificate Registry & Tracking System Operators
- Power Market Analytics, Forecasting & Hedging Software Platform Vendors
- Legal, Tax & Structured Finance Advisory Firms Specialising in PPAs
- Competitive Analysis Frameworks
- Market Share Analysis by PPA Type, Generation Technology & Region
- Company Profile
- Company Overview & Headquarters
- Corporate Renewable PPA Products, Service Portfolio & Platform Coverage
- Key Customer Relationships & Reference Corporate PPA Deals
- Origination Footprint, Pipeline & Contracted Capacity
- Revenue (Corporate Renewable PPA Segment) & Order Book
- Technology, Platform & Structuring Differentiators
- Key Strategic Partnerships, JVs & M&A Activity
- Recent Developments (Landmark PPA Signings, Platform Launches, Geographic Expansions)
- SWOT Analysis
- Strategic Focus Areas & Roadmap
- Competitive Positioning Map (Origination Capability vs. Market Penetration)
- Key Company Profiles
- Market Structure & Concentration
- Technology Landscape & Innovation Analysis
- Strategic Output
- Market Opportunity Matrix: By PPA Type, Generation Technology, Buyer Industry, End-User & Geography
- White Space Opportunity Analysis
- Strategic Recommendations
- Corporate Buyer Engagement & Procurement Roadmap Strategy
- Developer / IPP Origination & Counterparty Diversification Strategy
- Geographic Expansion & Market Entry Strategy (Liberalised vs. Regulated Markets)
- Contract Structuring, Settlement & Risk Management Strategy
- Partnership, M&A & Platform Strategy
- 24/7 Matching, Granular EAC & Future-Proof Sustainability Strategy
- Risk Mitigation & Future Roadmap
- Strategic Priority Matrix & Roadmap
- Near-term (2025-2028)
- Mid-term (2029-2032)
- Long-term (2033-2037)
- Market Size & Forecast
- Market Size & Forecast
- Market Size & Forecast
- Market Size & Forecast
- Market Size & Forecast
- Market Size & Forecast