Market Definition
The Global Agricultural Micronutrients Market encompasses the formulation, manufacturing, distribution, and application of essential trace mineral elements required by crop plants in small but physiologically critical quantities to complete normal growth, development, reproductive, and metabolic functions across all major crop types cultivated in field, orchard, plantation, greenhouse, and hydroponic production systems worldwide. Agricultural micronutrients are chemically distinct from macronutrients such as nitrogen, phosphorus, and potassium in that they are required by plants at concentrations measured in parts per million or milligrams per kilogram of soil or plant tissue rather than percentage levels, yet their deficiency or toxicity at even marginal deviations from the optimal supply range produces measurable and economically significant reductions in crop yield, quality, disease resistance, and nutritional value that directly impact farmer profitability and food system nutritional outcomes globally.
The market encompasses the seven universally recognized essential plant micronutrients comprising zinc, iron, manganese, boron, copper, molybdenum, and chlorine, together with the beneficial micronutrients nickel, cobalt, silicon, and selenium whose agronomic value is recognized across specific crop and soil systems, delivered through a diverse range of product formulation chemistries including inorganic salts such as zinc sulfate, ferrous sulfate, manganese sulfate, borax, and copper sulfate; chelated micronutrient complexes based on EDTA, DTPA, EDDHA, and amino acid chelation chemistries that enhance micronutrient solubility, soil mobility, and plant uptake efficiency; micronutrient oxide and carbonate forms used in soil-applied blended fertilizer products; foliar spray micronutrient formulations for direct leaf absorption; and micronutrient-enriched NPK compound fertilizer products incorporating trace elements at agronomically calibrated concentrations. The market further encompasses soil testing, tissue analysis, and digital soil mapping services that form the diagnostic foundation for micronutrient product recommendation and application optimization. Key participants include global specialty fertilizer and micronutrient manufacturers, agrochemical and crop nutrition companies, mining and mineral processing companies supplying micronutrient raw material sources, soil testing laboratories, agricultural advisory services, and farmer cooperatives and input distribution networks whose procurement and recommendation activities translate agronomic micronutrient requirements into commercial product demand across all major agricultural geographies globally.
Market Insights
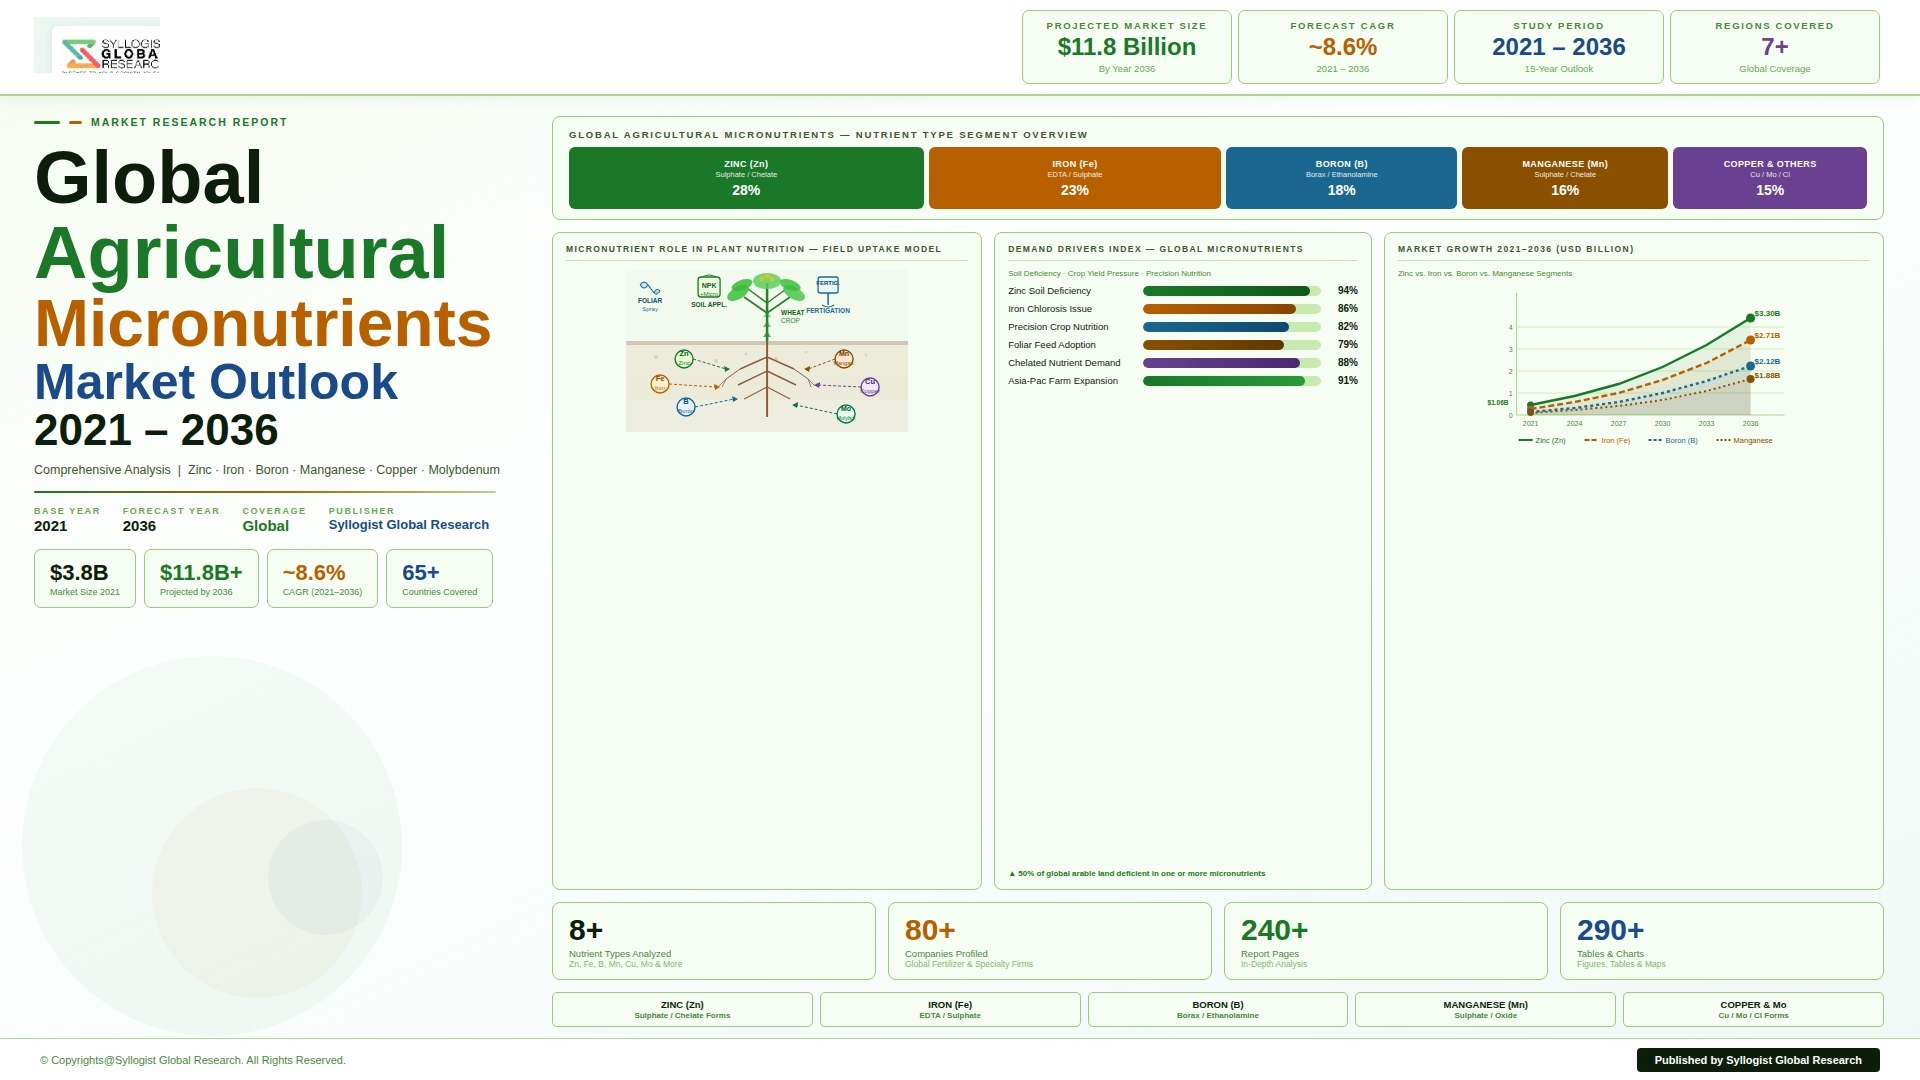
The global agricultural micronutrients market is entering a period of structurally reinforced demand expansion driven by the convergence of widespread and scientifically well-documented micronutrient deficiency across intensively cultivated agricultural soils on all inhabited continents, the growing agronomic and commercial recognition that yield gains from balanced micronutrient nutrition can substantially exceed the cost of micronutrient product application in deficient soils, and the expanding institutional frameworks linking crop micronutrient management to food system nutritional quality, biofortification program objectives, and sustainable intensification policy goals that are progressively elevating micronutrient nutrition from an optional agronomic refinement into a recognized productivity and quality management imperative. The global agricultural micronutrients market was valued at approximately USD 7.2 billion in 2025 and is projected to reach USD 12.8 billion by 2034, advancing at a compound annual growth rate of 6.6% over the forecast period from 2027 to 2034, supported by the expanding geographic awareness of micronutrient deficiency across South Asian, Southeast Asian, Sub-Saharan African, and Latin American agricultural systems, the premiumization of micronutrient product technology toward high-efficiency chelated and amino acid complexed formulations, and the growing integration of micronutrient management into precision agriculture programs that are delivering both agronomic performance and environmental compliance outcomes valued by commercially progressive farmers globally.
Zinc constitutes the single largest and most commercially significant micronutrient category within the global agricultural market, accounting for approximately 35% of total micronutrient market revenue in 2025, reflecting the extraordinary geographic prevalence of zinc deficiency across the world’s most intensively cultivated agricultural soils, with approximately 50% of global arable land estimated to exhibit zinc deficiency sufficient to constrain crop yield and quality, and zinc deficiency being the most widely documented micronutrient limitation in cereal, pulse, and vegetable production systems across South Asia, China, Southeast Asia, Turkey, and Central Asian agricultural regions where calcareous, alkaline, waterlogged, and sandy soils with low organic matter content are structurally prone to zinc immobility and inadequate plant uptake. India alone accounts for approximately 70% of its cultivated soils exhibiting zinc deficiency at levels affecting crop productivity, generating annual zinc fertilizer demand from India’s agricultural sector of approximately 280,000 metric tonnes of zinc sulfate across rice, wheat, maize, vegetables, and horticulture crops, with the Indian government’s fertilizer subsidy framework covering a portion of zinc sulfate cost making it the single largest government-supported micronutrient product category in any national agricultural market. The market for chelated zinc products, including EDTA-chelated zinc and amino acid zinc complexes offering superior plant uptake efficiency, soil stability, and compatibility with fertigation and foliar application methods compared to inorganic zinc sulfate, is growing at approximately 9.8% annually as precision nutrition programs, high-value horticulture production, and drip fertigation adoption progressively shift zinc application from bulk soil incorporation toward high-efficiency delivery formats that deliver measurable yield and quality response at lower application rates. Iron and manganese micronutrient products represent the second and third largest categories by revenue respectively, with iron deficiency chlorosis being a pervasive productivity constraint in calcareous and high-pH soils across the Mediterranean, Middle East, Iran, and Western India, and manganese deficiency affecting cereals, oilseeds, and legumes in acid sandy soils across Northern European and Australian agricultural regions.
The chelated micronutrient product segment is the most technically differentiated and highest-value product category within the global agricultural micronutrients market, commanding premium prices of two to ten times the cost of equivalent inorganic micronutrient salt products due to the demonstrably superior agronomic performance of chelated forms in alkaline, calcareous, and high-pH soil environments where free metal ions from inorganic sources are rapidly precipitated into plant-unavailable mineral complexes within hours of soil application, rendering conventional zinc sulfate, iron sulfate, and manganese sulfate applications largely ineffective without chelation protection. EDDHA-chelated iron, which maintains iron solubility and plant availability across the full agricultural soil pH range from 4.0 to 9.5, has become the agronomic gold standard for correcting iron deficiency chlorosis in calcareous orchards, vineyards, and high-value crop systems across the Mediterranean, Middle East, and California, with EDDHA iron products commanding prices of USD 8 to USD 15 per kilogram compared to USD 0.5 to USD 1.2 per kilogram for ferrous sulfate, reflecting the iron bioavailability performance differential that translates directly into commercial value for fruit growers whose orchard investment and export quality targets depend on maintaining adequate leaf iron nutrition. The amino acid chelated micronutrient segment, offering biodegradable chelation chemistry with additional plant biostimulant effects from the amino acid carrier molecules, is the fastest-growing chelation chemistry category at approximately 12.3% annually, driven by its compatibility with organic farming certification requirements, its soil microbiome compatibility advantages relative to synthetic EDTA chelation, and the growing adoption of amino acid-complexed multi-micronutrient foliar products by precision horticulture, viticulture, and high-value vegetable production systems seeking integrated crop nutrition and biostimulant solutions from a single product application. The micronutrient-fortified NPK blended fertilizer segment is experiencing significant demand growth in markets including Brazil, India, and Southeast Asia where bulk blending facilities are increasingly incorporating zinc sulfate, borax, copper sulfate, and manganese sulfate into NPK blend formulations at standard treat rates, delivering micronutrient nutrition to farmers through the existing NPK supply chain without requiring separate micronutrient product purchase and application decisions.
From a regional standpoint, Asia-Pacific dominates the global agricultural micronutrients market, accounting for approximately 48% of total market revenue in 2025, driven by the continental scale of micronutrient-deficient agricultural soils across India, China, Bangladesh, Pakistan, Indonesia, Vietnam, and Thailand, the enormous cropped area under rice, wheat, corn, and vegetable cultivation in these countries, and the progressively expanding farmer awareness of micronutrient deficiency symptoms and correction economics supported by national soil testing programs, extension service outreach, and agrochemical company field demonstration programs. China’s agricultural micronutrient market, valued at approximately USD 1.4 billion in 2025, is characterized by the simultaneous challenges of widespread zinc, iron, boron, and molybdenum deficiency across the country’s diverse soil types and the regulatory complexity of China’s soil amendment and fertilizer registration system, with the Chinese government’s soil testing and formula fertilization program having conducted over 200 million soil tests since its inception and generating a massive database of micronutrient deficiency mapping that informs provincial fertilizer recommendation standards and has materially increased farmer awareness of targeted micronutrient application benefits. Latin America, led by Brazil’s massive and commercially sophisticated agricultural sector, represents the second-fastest growing regional market at approximately 7.8% annually, driven by the boron deficiency pervasive in tropical oxisol soils under soybean, cotton, coffee, and sugarcane cultivation, the expanding precision nutrition programs of Brazilian large-scale commercial farmers integrating chelated micronutrient programs into their crop protection and nutrition management systems, and the regulatory incentive of Brazil’s biostimulant and specialty nutrition registration framework that has created a commercially dynamic market for advanced chelated and complexed micronutrient product innovation. Europe, while representing a more mature micronutrient market than Asia-Pacific or Latin America, maintains solid demand growth driven by the shift toward sustainable farming practices requiring precision nutrient management, the growing adoption of foliar micronutrient programs in high-value crop systems, and the regulatory framework of the EU Fertilising Products Regulation which has harmonized product registration requirements across member states and facilitated the market entry of innovative chelated and biostimulant-integrated micronutrient formulations.
Key Drivers
Pervasive Global Soil Micronutrient Depletion From Intensive Cropping and the Expanding Economic Evidence Base for Micronutrient Correction Investment
The progressive depletion of plant-available micronutrients from intensively cultivated agricultural soils through continuous crop removal without commensurate replacement, the reduction of soil organic matter that serves as a critical carrier and slow-release reservoir for micronutrients, the increasing use of high-analysis NPK fertilizers containing no micronutrient components, and the rising soil pH in many irrigated systems from alkaline irrigation water use are collectively creating a structural and geographically expanding micronutrient deficiency landscape across global agriculture that is directly translating into commercial demand for micronutrient correction products as farmer awareness of yield gap origins improves. The economic return from micronutrient correction in deficient soils is among the most favorable input investment ratios in commercial agriculture, with independent agronomic trials across zinc-deficient rice and wheat systems in South Asia documenting yield responses of 15% to 40% from zinc sulfate application at a cost of USD 8 to USD 25 per hectare, representing an investment-to-return ratio of 1:8 to 1:20 that is commercially compelling for any farm operator with access to agronomic diagnosis and quality product supply. The expanding network of soil health diagnostic programs, including India’s Soil Health Card scheme covering over 230 million cards issued to farmers, China’s soil testing and formula fertilization program, and national soil monitoring programs across the European Union, Brazil, and Australia, is systematically identifying and communicating micronutrient deficiency status to farmer populations at a scale that directly translates agronomic awareness into product demand across the micronutrient supply chain by converting undiagnosed hidden hunger constraints into actionable commercial soil nutrition management decisions.
Crop Quality and Human Nutrition Imperatives Driving Biofortification Programs and Premium Produce Market Micronutrient Management Requirements
The global recognition that micronutrient deficiencies in staple food crops represent a primary driver of human hidden hunger affecting an estimated 2 billion people worldwide, whose diets are chronically deficient in zinc, iron, selenium, and iodine due to the consumption of micronutrient-depleted cereal and legume staples produced on deficient soils, is elevating agricultural micronutrient management from a purely productivity-oriented agronomic intervention into a food system and public health priority whose governance extends to the highest levels of national nutrition policy and international development agency programming. The HarvestPlus biofortification program and associated national biofortification initiatives across sub-Saharan Africa, South Asia, and Latin America are creating agronomic frameworks that link soil zinc and iron supply management through micronutrient fertilization to the nutritional quality composition of harvested grain, flour, and vegetable products, generating institutional and commercial demand for micronutrient fertilization programs that deliver measurable grain zinc and iron concentration improvements in wheat, rice, maize, and bean crops serving national staple food supply chains. Premium produce market quality standards increasingly specify minimum micronutrient content thresholds for fresh fruits, vegetables, and specialty crops supplied to European, North American, and Japanese high-value retail and export markets, creating commercial incentives for growers serving premium channels to invest in foliar zinc, boron, calcium, and iron micronutrient programs that deliver measurable produce quality improvements in shelf life, skin finish, flavor profile, and nutritional content labeling compliance that translate directly into premium price realization and market access maintenance for export-oriented commercial farm operations.
Precision Agriculture and Fertigation Technology Adoption Creating Demand for High-Efficiency Chelated and Water-Soluble Micronutrient Formulations
The global expansion of drip irrigation and fertigation systems, which deliver solubilized nutrient solutions directly to the plant root zone through pressurized microirrigation infrastructure, is creating structural demand for fully water-soluble and chemically stable chelated micronutrient products that can be incorporated into fertigation injection programs without clogging emitters, reacting with other dissolved nutrients, or precipitating in alkaline irrigation water, and whose plant uptake efficiency through root zone delivery substantially exceeds that of soil-incorporated inorganic micronutrient salts whose mobility and availability in the root zone are constrained by soil pH, competing ion interactions, and sorption onto soil mineral surfaces. The global drip-irrigated area has expanded to approximately 16.8 million hectares in 2025, with the highest growth concentrated in India, China, Spain, Morocco, and Israel, and the conversion of each additional hectare from flood to drip irrigation creates a corresponding transition in micronutrient application methodology from bulk soil incorporation of inorganic salts toward continuous low-rate fertigation with chelated and fully soluble micronutrient products whose per-hectare annual cost is substantially higher than equivalent inorganic applications, generating a commercial value uplift in the micronutrient market that is structurally linked to drip irrigation adoption growth. The integration of variable rate micronutrient application capabilities into precision agriculture platforms, enabling site-specific micronutrient application prescriptions derived from high-resolution soil variability maps generated through proximal soil sensing and satellite remote sensing platforms, is creating demand for micronutrient products compatible with variable rate application equipment and supported by geospatial application management software, representing a technically sophisticated and premium-priced market segment that is growing rapidly among large-scale commercial arable and horticulture operators in North America, Europe, Brazil, and Australia.
Key Challenges
Complex Soil Chemistry Interactions and Narrow Optimal Application Range Creating Product Efficacy Uncertainty and Farmer Adoption Risk
Agricultural micronutrient products must navigate an extraordinarily complex soil chemical environment in which the plant-available fraction of applied micronutrients is determined by the simultaneous interaction of soil pH, organic matter content, clay mineral type, cation exchange capacity, competing ion concentrations, microbial activity, redox potential, and irrigation water chemistry that collectively make micronutrient behavior in soil systems highly site-specific, temporally variable, and difficult to predict from standard soil test parameters alone, creating agronomic efficacy uncertainty that constitutes a genuine adoption barrier for farmers considering micronutrient investment without access to high-quality soil diagnostic services and locally calibrated agronomic recommendation frameworks. The narrow optimal range between deficiency and phytotoxicity for certain micronutrients, most critically boron whose threshold between deficiency and toxicity in sensitive crops such as grapes, stone fruits, and brassicas spans a soil application rate range of as little as 1 to 2 kilograms per hectare of borax at a single application event, creates a real risk of crop damage from over-application by farmers making application rate decisions without access to current soil boron analysis, creating a negative market signal among farmer communities with personal or communal experience of boron toxicity damage that constrains adoption rates in geographies where boron deficiency correction would otherwise be agronomically beneficial. The challenge of distinguishing micronutrient deficiency symptoms from visually similar nutrient imbalances, drought stress, pest damage, or disease expression in field crop situations requires diagnostic expertise that is not universally available across the global agricultural advisory infrastructure, resulting in misdiagnosis of micronutrient deficiency as other production constraints and vice versa, creating both missed market opportunity and misdirected product application that generates suboptimal agronomic outcomes undermining farmer confidence in micronutrient product value.
Fragmented Regulatory Registration Frameworks Across Global Markets Creating Market Entry Complexity and Product Development Investment Barriers for Micronutrient Manufacturers
The regulatory landscape governing the registration, labeling, composition claim approval, and market authorization of agricultural micronutrient fertilizer products varies substantially across the major global agricultural markets, with the European Union’s EU Fertilising Products Regulation, the United States Environmental Protection Agency and state department of agriculture fertilizer label registration systems, India’s Fertiliser Control Order, China’s Ministry of Agriculture fertilizer registration requirements, and Brazil’s MAPA agricultural input registration framework each imposing distinct product composition specifications, efficacy documentation requirements, heavy metal contaminant limits, labeling format obligations, and registration fee and timeline structures that require micronutrient product manufacturers seeking global market access to maintain parallel registration portfolios across multiple regulatory jurisdictions at significant ongoing administrative and analytical cost. The EU Fertilising Products Regulation’s transition from national to harmonized EU-level product registration, while ultimately simplifying the European market access pathway for compliant products, has created a regulatory transition period uncertainty during which products approved under legacy national registration systems must be progressively reformulated or re-registered to comply with the harmonized EU regulation’s micronutrient concentration limits, chelating agent approved list restrictions, and heavy metal ceiling requirements, imposing product reformulation costs and temporary market access constraints on manufacturers whose existing product portfolios do not fully align with the harmonized EU specification requirements. The divergence in maximum permissible heavy metal contaminant limits, particularly for cadmium, lead, and arsenic in micronutrient fertilizer raw materials including zinc sulfate, copper sulfate, and boron sources across different national regulatory frameworks, creates supply chain sourcing complexity for manufacturers seeking to produce globally compliant formulations from a single production facility using raw material sources that meet the most stringent applicable standard.
Counterfeit and Adulterated Micronutrient Products in Developing Market Supply Chains Undermining Product Efficacy and Farmer Investment Returns
The global agricultural micronutrients market, particularly across the high-volume developing market segments in South Asia, Southeast Asia, and Sub-Saharan Africa where smallholder farmer demand is served through extended and loosely regulated distribution chains, is significantly impacted by the widespread availability of counterfeit, adulterated, and misrepresented micronutrient fertilizer products that are sold under misleading labeling claims at price points below the cost of genuinely formulated products, undermining the agronomic efficacy outcomes experienced by farmer users and generating a pervasive market quality integrity challenge that constrains farmer willingness to reinvest in micronutrient products following disappointing experiences with substandard materials. The most commercially significant adulteration practices in the micronutrient fertilizer market include the dilution of zinc sulfate with fillers and inert carriers to below declared nutrient concentration, the substitution of ineffective inorganic micronutrient oxides or silicates for declared chelated forms in premium-positioned products, the misrepresentation of zinc sulfate monohydrate as the higher-concentration heptahydrate form to inflate apparent product value, and the sale of poorly formulated foliar spray products with declared micronutrient concentrations that are not plant-available due to formulation chemistry failures that are not detectable through simple visual product inspection by farmer buyers. India’s Fertiliser Control Order enforcement mechanism and the Bureau of Indian Standards certification regime for zinc sulfate and borax products provide a partial quality assurance framework, but the geographic distribution of enforcement agency resources relative to the scale of the agricultural input retail network and the sophistication of adulteration practices means that a meaningful proportion of retail micronutrient product volume in rural markets fails to deliver the nutrient concentration and plant availability performance represented on product labels.
Market Segmentation
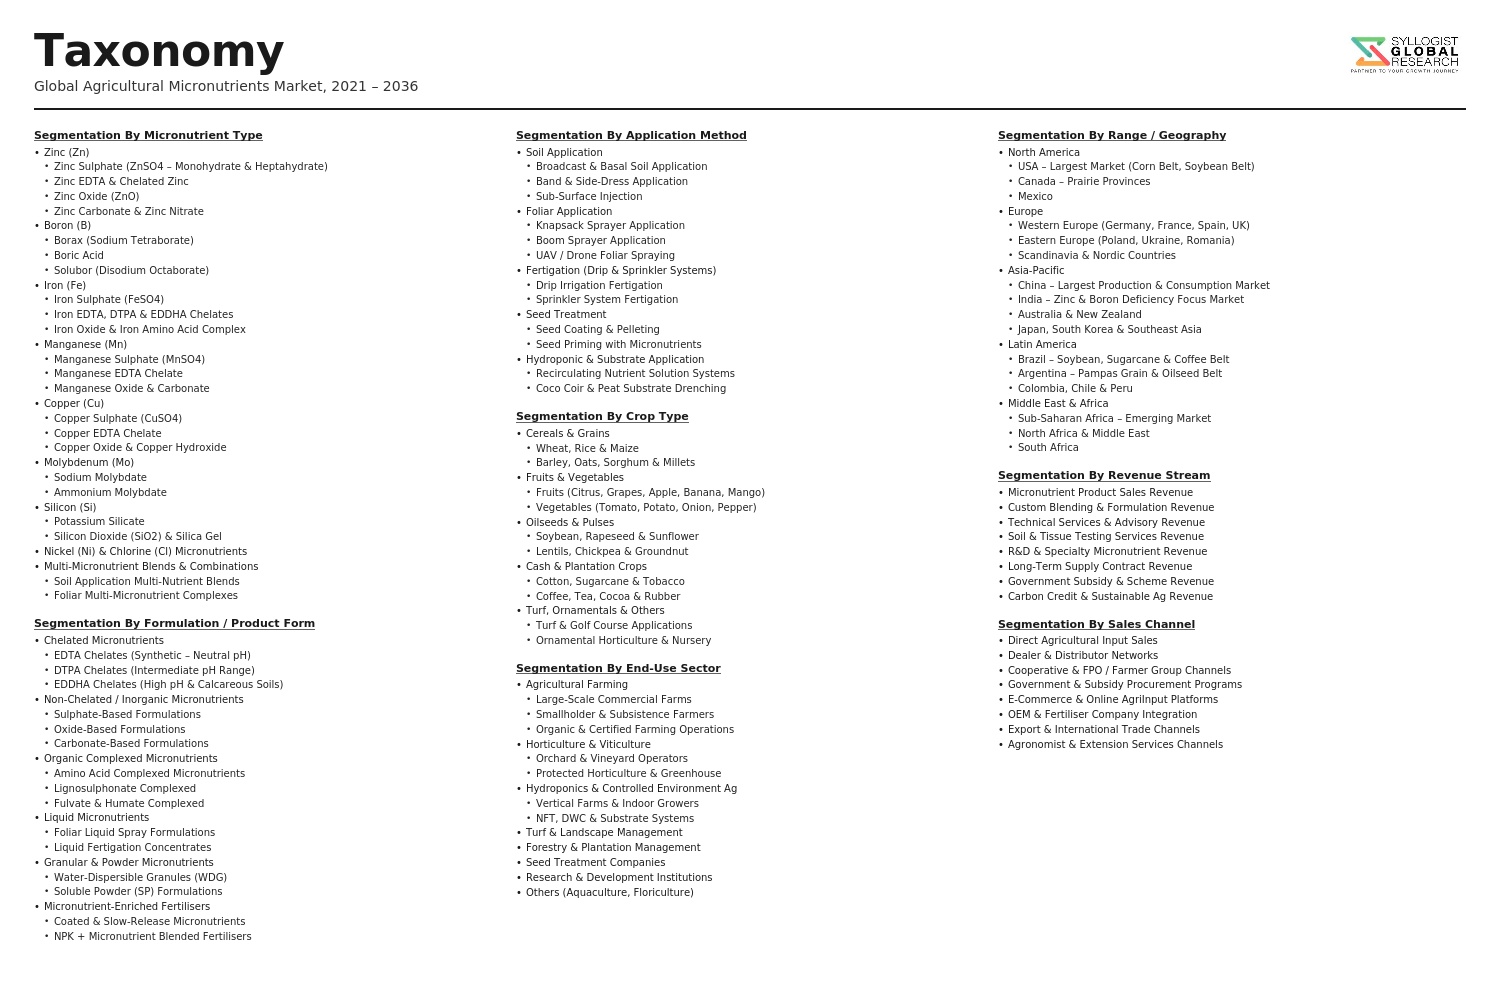
Segmentation By Micronutrient Type
- Zinc Micronutrients
- Iron Micronutrients
- Manganese Micronutrients
- Boron Micronutrients
- Copper Micronutrients
- Molybdenum Micronutrients
- Nickel and Cobalt Micronutrients
- Multi-Micronutrient and Combination Products
- Others
Segmentation By Product Form
- Chelated Micronutrients (EDTA, DTPA, EDDHA Chelates)
- Amino Acid and Organic Acid Complexed Micronutrients
- Inorganic Salt Micronutrients (Sulfates, Chlorides, Nitrates)
- Oxide and Carbonate Micronutrient Forms
- Micronutrient-Fortified NPK Blended Fertilizers
- Foliar Spray Micronutrient Formulations
- Slow-Release and Coated Micronutrient Products
- Liquid and Suspension Micronutrient Concentrates
- Others
Segmentation By Application Method
- Soil Application (Broadcast and Incorporation)
- Foliar Spray Application
- Fertigation and Drip Irrigation Application
- Seed Priming and Seed Coating Application
- Hydroponics and Substrate Growing Media Application
- Others
Segmentation By Crop Type
- Cereals and Grains (Rice, Wheat, Maize, Barley)
- Fruits and Orchards (Apple, Citrus, Grape, Mango, Stone Fruits)
- Vegetables (Tomato, Potato, Onion, Leafy Vegetables)
- Oilseeds and Pulses (Soybean, Groundnut, Chickpea, Lentil)
- Cash Crops (Sugarcane, Cotton, Tobacco)
- Plantation Crops (Coffee, Tea, Rubber, Oil Palm)
- Turf, Floriculture, and Ornamentals
- Others
Segmentation By Farming System
- Conventional Farming Systems
- Organic and Certified Sustainable Farming Systems
- Precision Agriculture and Site-Specific Nutrient Management
- Greenhouse and Controlled Environment Production
- Hydroponics and Soilless Growing Systems
- Others
Segmentation By Distribution Channel
- Direct Sales to Large Commercial Farms and Cooperatives
- Agrochemical and Fertilizer Dealer Network
- Government Agricultural Input Supply Programs
- E-Commerce and Digital Agricultural Input Platforms
- Crop Nutrition Advisory and Precision Agriculture Service Providers
- Others
Segmentation By Region
- North America
- Europe
- Asia-Pacific
- Latin America
- Middle East and Africa
All market revenues are presented in USD
Historical Year: 2021-2024 | Base Year: 2025 | Estimated Year: 2026 | Forecast Period: 2027-2034
Key Questions this Study Will Answer
- What is the total global market valuation of the Agricultural Micronutrients Market in the base year 2025, and what is the projected market size and compound annual growth rate through 2034, disaggregated by micronutrient type, product form, application method, crop type, and region, to enable micronutrient manufacturers, specialty fertilizer companies, agrochemical distributors, and agricultural investors to identify which nutrient categories, formulation technologies, and geographic markets will generate the highest absolute revenue and the most sustained demand growth across the forecast period?
- How is the global prevalence of zinc, iron, boron, manganese, and copper deficiency across the major agricultural soils of South Asia, China, Southeast Asia, Sub-Saharan Africa, and Latin America being quantified through national soil testing programs and field diagnostic research, what are the estimated yield gap magnitudes and economic loss values attributable to micronutrient deficiency across the key cereal, oilseed, and horticulture crop systems in each major producing region, and how is growing farmer awareness of these yield gaps translating into measurable micronutrient product adoption rates and market volume growth across the forecast period?
- What is the current market share distribution between inorganic salt micronutrient products, synthetic chelated formulations, and amino acid and organic acid complexed micronutrient products across major geographic markets and crop application segments, what agronomic performance, regulatory compliance, and environmental sustainability factors are driving the premiumization trend toward chelated and complexed micronutrient formulations at the expense of conventional inorganic salt products, and what is the projected market value and volume trajectory for each formulation chemistry category through 2034?
- How are the biofortification program objectives of international development agencies, national nutrition policy mandates targeting grain zinc and iron content improvement, and premium produce export market micronutrient quality specifications collectively reshaping the commercial demand architecture of the global agricultural micronutrients market beyond traditional yield productivity applications, and which micronutrient product categories, crop systems, and geographic markets are expected to generate the highest incremental demand from biofortification and nutritional quality improvement program requirements through 2034?
- Who are the leading global agricultural micronutrient manufacturers, chelated nutrient specialty companies, and micronutrient-integrated crop nutrition solution providers currently defining the competitive landscape of the global market, and what are their respective product portfolios across inorganic, chelated, and complexed formulation categories, regulatory registration footprints across major agricultural markets, soil testing and diagnostic service capabilities, precision agriculture platform integration strategies, distribution network depth in developing market geographies, and research and development investment priorities for next-generation micronutrient delivery technologies including nano-formulations, biostimulant-integrated complexes, and controlled-release mineral nutrition systems?
- Product Definition
- Research Methodology
- Research Design & Framework
- Overall Research Approach: Descriptive, Exploratory & Quantitative Mixed-Method Design
- Market Definition & Scope Boundaries: What is Included and Excluded
- Segmentation Framework
- Key Research Assumptions & Limitations
- Secondary Research
- Primary Research Design & Execution
- Data Triangulation & Validation
- Market Sizing & Forecasting Methodology
- Competitive Intelligence Methodology
- Quality Assurance & Peer Review
- Definitions, Abbreviations & Data Notes
- Research Design & Framework
- Executive Summary
- Market Snapshot & Headline Numbers
- Key Findings & Research Highlights
- Market Dynamics
- Regional Market Summary
- Competitive Landscape Snapshot
- Technology & Innovation Highlights
- Market Dynamics
- Drivers
- Restraints
- Opportunities
- Challenges
- Porter’s Five Forces Analysis
- PESTLE Analysis
- Market Trends & Developments
- Emerging Trends
- Technological Developments
- Regulatory & Policy Changes
- Supply Chain & Sourcing Trends
- Manufacturing & Process Trends
- Investment & Funding Activity
- Sustainability & ESG Trends
- Risk Assessment Framework
- Raw Material Price Volatility, Mining Concentration & Critical Mineral Supply Chain Disruption Risk
- Overuse, Soil Toxicity, Leaching & Environmental Contamination Risk from Micronutrient Misapplication
- Regulatory Tightening, Maximum Residue Limits (MRLs) & Heavy Metal Contamination Compliance Risk
- Farmer Awareness Deficit, Soil Testing Infrastructure Gap & Adoption Barrier Risk in Emerging Markets
- Counterfeit & Adulterated Micronutrient Product Market Risk Across Developing Regions
- Regulatory Framework & Standards
- Fertiliser Control Order (FCO) & National Fertiliser Policy Frameworks Governing Micronutrient Product Registration & Quality Standards
- EU Fertilising Products Regulation (EU 2019/1009), CE Marking & Micronutrient Limit Standards for European Markets
- US EPA, AAPFCO & State Fertiliser Regulations Applicable to Micronutrient Product Labelling & Registration
- Codex Alimentarius, Maximum Residue Limits (MRLs) & Food Safety Standards Influencing Micronutrient Application Rates
- Organic Certification Standards (USDA NOP, EU Organic Regulation), Permitted Micronutrient Sources & Chelate Approval Frameworks
- Global Agricultural Micronutrients Market Outlook
- Market Size & Forecast by Value
- Market Size & Forecast by Volume (Metric Tonnes)
- Market Size & Forecast by Micronutrient Type
- Zinc
- Boron
- Iron
- Manganese
- Copper
- Molybdenum
- Chlorine
- Nickel
- Multinutrient & Micronutrient Blend Products
- Market Size & Forecast by Form
- Chelated Micronutrients (EDTA, DTPA, EDDHA & Amino Acid Chelates)
- Non-Chelated & Inorganic Micronutrient Salts (Sulphates, Oxides & Chlorides)
- Micronutrient Enriched Fertilisers & Blended NPK Products
- Micronutrient Suspension Concentrates & Liquid Formulations
- Slow-Release & Coated Micronutrient Granules
- Micronutrient Foliar Sprays & Water-Soluble Powder Formulations
- Bio-Available & Nano-Micronutrient Formulations
- Market Size & Forecast by Application Method
- Soil Application (Broadcast & Band Application)
- Foliar Spray Application
- Fertigation & Drip Irrigation Application
- Seed Treatment & Priming
- Hydroponic & Substrate Growing Medium Application
- Market Size & Forecast by Crop Type
- Cereals & Grains (Wheat, Rice, Maize & Barley)
- Oilseeds & Pulses (Soybean, Canola, Groundnut & Lentils)
- Fruits & Orchards (Citrus, Grapes, Mango & Apples)
- Vegetables & Leafy Greens
- Plantation & Cash Crops (Sugarcane, Cotton, Coffee & Tea)
- Turf, Ornamentals & Floriculture
- Market Size & Forecast by Soil Type Deficiency
- Calcareous & Alkaline Soils (Iron & Zinc Deficiency)
- Sandy & Light-Textured Soils (Boron & Copper Deficiency)
- Acidic & Leached Soils (Molybdenum & Calcium Deficiency)
- Waterlogged & Anaerobic Soils (Manganese Toxicity & Zinc Deficiency)
- Market Size & Forecast by End-User
- Individual Farmers & Smallholders
- Large Commercial Farms & Agricultural Enterprises
- Greenhouse & Controlled Environment Agriculture Operators
- Agri-Input Companies & Fertiliser Blenders
- Government Agricultural Development Agencies
- Research Institutes & Agricultural Universities
- Market Size & Forecast by Sales Channel
- Agri-Input Dealer & Distributor Network
- Direct Sales to Commercial Farms & Cooperatives
- Government Subsidy & Procurement Programme
- Online & E-Commerce Platform
- Integrated Crop Nutrition & Advisory Service Provider
- North America Agricultural Micronutrients Market Outlook
- Market Size & Forecast
- By Value
- By Volume (Metric Tonnes)
- By Micronutrient Type
- By Form
- By Application Method
- By Crop Type
- By End-User
- By Country
- By Sales Channel
- Market Size & Forecast
- Europe Agricultural Micronutrients Market Outlook
- Market Size & Forecast
- By Value
- By Volume (Metric Tonnes)
- By Micronutrient Type
- By Form
- By Application Method
- By Crop Type
- By End-User
- By Country
- By Sales Channel
- Market Size & Forecast
- Asia-Pacific Agricultural Micronutrients Market Outlook
- Market Size & Forecast
- By Value
- By Volume (Metric Tonnes)
- By Micronutrient Type
- By Form
- By Application Method
- By Crop Type
- By End-User
- By Country
- By Sales Channel
- Market Size & Forecast
- Latin America Agricultural Micronutrients Market Outlook
- Market Size & Forecast
- By Value
- By Volume (Metric Tonnes)
- By Micronutrient Type
- By Form
- By Application Method
- By Crop Type
- By End-User
- By Country
- By Sales Channel
- Market Size & Forecast
- Middle East & Africa Agricultural Micronutrients Market Outlook
- Market Size & Forecast
- By Value
- By Volume (Metric Tonnes)
- By Micronutrient Type
- By Form
- By Application Method
- By Crop Type
- By End-User
- By Country
- By Sales Channel
- Market Size & Forecast
- Country-Wise* Agricultural Micronutrients Market Outlook
- Market Size & Forecast
- By Value
- By Volume (Metric Tonnes)
- By Micronutrient Type
- By Form
- By Application Method
- By Crop Type
- By End-User
- By Country
- By Sales Channel
- Market Size & Forecast
- *Countries Analyzed in the Syllogist Global Research Portfolio: United States, Canada, Mexico, Germany, France, United Kingdom, Netherlands, Spain, Italy, Norway, Sweden, China, Japan, India, Australia, South Korea, Singapore, Brazil, Chile, Saudi Arabia, UAE, Egypt, South Africa, Israel
- Technology Landscape & Innovation Analysis
- Chelation Technology Deep-Dive: EDTA, DTPA, EDDHA & Next-Generation Amino Acid & Lignosulfonate Chelate Efficiency
- Nano-Micronutrient & Nano-Fertiliser Technology: Particle Size, Bioavailability Enhancement & Soil Interaction Mechanisms
- Slow-Release & Polymer-Coated Micronutrient Technology for Controlled Nutrient Delivery & Loss Reduction
- Micronutrient Seed Treatment Technology: Coating, Priming & Film-Forming Formulation for Enhanced Seedling Nutrition
- Precision Micronutrient Management Technology: Soil Sensor Integration, Variable Rate Application & Digital Nutrient Mapping
- Biostimulant & Micronutrient Combination Formulation Technology for Synergistic Crop Nutrition & Stress Tolerance
- Fertigation-Optimised Water-Soluble Micronutrient Technology for Drip & Sprinkler Integrated Nutrition Programmes
- Patent & IP Landscape in Agricultural Micronutrient Technologies
- Value Chain & Supply Chain Analysis
- Zinc, Boron, Iron, Manganese & Copper Mining, Ore Processing & Primary Metal Refining Supply Chain
- Chelating Agent, EDTA & Organic Acid Intermediate Manufacturing Supply Chain
- Micronutrient Salt Synthesis, Chelation, Formulation & Quality Testing Manufacturing Supply Chain
- Granulation, Blending, Packaging & Agronomic Formulation Supply Chain
- Agri-Input Dealer, Distributor & Cooperative Sales Channel
- Crop Nutrition Advisory, Soil Testing Laboratory & Precision Agriculture Service Channel
- Waste, By-Product & Spent Chelate Treatment & Recycling Value Chain
- Pricing Analysis
- Chelated vs. Non-Chelated Micronutrient Price Premium & Value-in-Use Analysis by Micronutrient Type
- Zinc Sulphate, Zinc EDTA & Zinc Oxide Unit Price Benchmarking Across Key Global Markets
- Boron, Iron, Manganese & Copper Micronutrient Product Pricing: Form & Grade Comparison
- Foliar Spray vs. Soil Application vs. Fertigation Micronutrient Product Cost per Hectare Analysis
- Nano-Micronutrient & Slow-Release Formulation Price Premium vs. Conventional Product Analysis
- Total Micronutrient Cost per Tonne of Crop Produced Across Key Crop & Market Segments
- Sustainability & Environmental Analysis
- Lifecycle Assessment (LCA) of Agricultural Micronutrients: Carbon Footprint, Mining Impact & Production Energy Intensity
- Micronutrient Use Efficiency, Leaching Loss Reduction & Environmental Load Minimisation Through Chelation & Precision Application
- Soil Health, Microbial Activity & Long-Term Fertility Impact of Micronutrient Application Programmes
- Heavy Metal Contamination, Cadmium Co-Occurrence & Soil Toxicity Risk Management in Micronutrient Products
- Regulatory-Driven Sustainability, SDG 2 (Zero Hunger), SDG 3 (Good Health), SDG 15 (Life on Land) & ESG Disclosure Alignment
- Competitive Landscape
- Market Structure & Concentration
- Market Consolidation Level (Fragmented vs. Consolidated by Micronutrient Type & Geography)
- Top 10 Players Market Share
- HHI (Herfindahl-Hirschman Index) Concentration Analysis
- Competitive Intensity Map by Micronutrient Type, Form & Region
- Player Classification
- Global Integrated Crop Nutrition & Specialty Fertiliser Majors
- Dedicated Chelated Micronutrient Manufacturers & Chelation Technology Specialists
- Mining-Integrated Micronutrient Producers (Zinc, Boron & Copper)
- Water-Soluble Fertiliser & Micronutrient Blend Manufacturers
- Biostimulant & Micronutrient Combination Product Companies
- Nano-Fertiliser & Advanced Micronutrient Formulation Start-Ups
- Regional Agri-Input Companies & Private Label Micronutrient Formulators
- Agri-Input Distributors, Cooperatives & Trading Companies
- Competitive Analysis Frameworks
- Market Share Analysis by Micronutrient Type, Form & Region
- Company Profile
- Company Overview & Headquarters
- Agricultural Micronutrient Products & Crop Nutrition Portfolio
- Key Customer Relationships & Reference Markets
- Manufacturing Footprint & Production Capacity
- Revenue (Agricultural Micronutrient Segment) & Order Book
- Technology Differentiators & IP
- Key Strategic Partnerships, JVs & M&A Activity
- Recent Developments (Product Launches, Capacity Expansion, Regulatory Approvals)
- SWOT Analysis
- Strategic Focus Areas & Roadmap
- Competitive Positioning Map (Product Breadth vs. Market Penetration)
- Key Company Profiles
- Market Structure & Concentration
- Strategic Opportunity Analysis
- Strategic Output
- Market Opportunity Matrix: By Micronutrient Type, Form, Application Method, Crop Type, End-User & Geography
- White Space Opportunity Analysis
- Strategic Recommendations
- Product Portfolio & Technology Investment Strategy
- Manufacturing & Operational Excellence Strategy
- Geographic Expansion & Localisation Strategy
- Customer & End-User Engagement Strategy
- Partnership, M&A & Ecosystem Strategy
- Sustainability & Circular Economy Strategy
- Risk Mitigation & Future Roadmap
- Strategic Priority Matrix & Roadmap
- Near-term (2025-2028)
- Mid-term (2029-2032)
- Long-term (2033-2037)
- Strategic Output