Market Definition
The Global LNG Bunkering Market encompasses the procurement, storage, transfer, and delivery of liquefied natural gas as a marine fuel to oceangoing vessels, coastal ships, inland waterway craft, and offshore support vessels operating across international shipping lanes, port approaches, and coastal trade routes, including the complete value chain of LNG bunkering infrastructure, logistics, services, and regulatory compliance that enables ship operators to utilize LNG as a primary or dual-fuel propulsion energy source in place of conventional marine fuel oil and marine gas oil. LNG bunkering involves the cryogenic storage of natural gas chilled to approximately minus 162 degrees Celsius at atmospheric pressure to achieve a volumetric energy density sufficient for practical marine fuel storage, and its transfer to vessel fuel tanks through truck-to-ship, port-based terminal-to-ship, or ship-to-ship bunkering operations utilizing specialized cryogenic transfer equipment, vapor return management systems, emergency shutdown devices, and metering infrastructure compliant with ISO 20519 and applicable port authority safety protocols.
The market encompasses LNG bunkering terminal infrastructure including onshore storage tanks, jetty-mounted loading arms, and small-scale LNG regasification and liquefaction facilities; purpose-built LNG bunkering vessels operating as floating supply platforms in major hub ports; LNG fuel tank system equipment installed aboard LNG-fueled vessels; bunkering operations services including fuel quality testing, quantity surveying, and safety management; and the regulatory, certification, and training frameworks governing LNG bunkering operations under the International Maritime Organization’s International Code of Safety for Ships Using Gases or Other Low-Flashpoint Fuels. Key participants include LNG bunkering terminal operators, energy majors and gas trading companies supplying LNG as marine fuel, purpose-built LNG bunkering vessel owners and operators, shipyards and fuel system integrators, ship operators adopting LNG propulsion, classification societies, and port authorities whose infrastructure investment and safety approval processes define the pace of LNG bunkering network expansion globally.
Market Insights
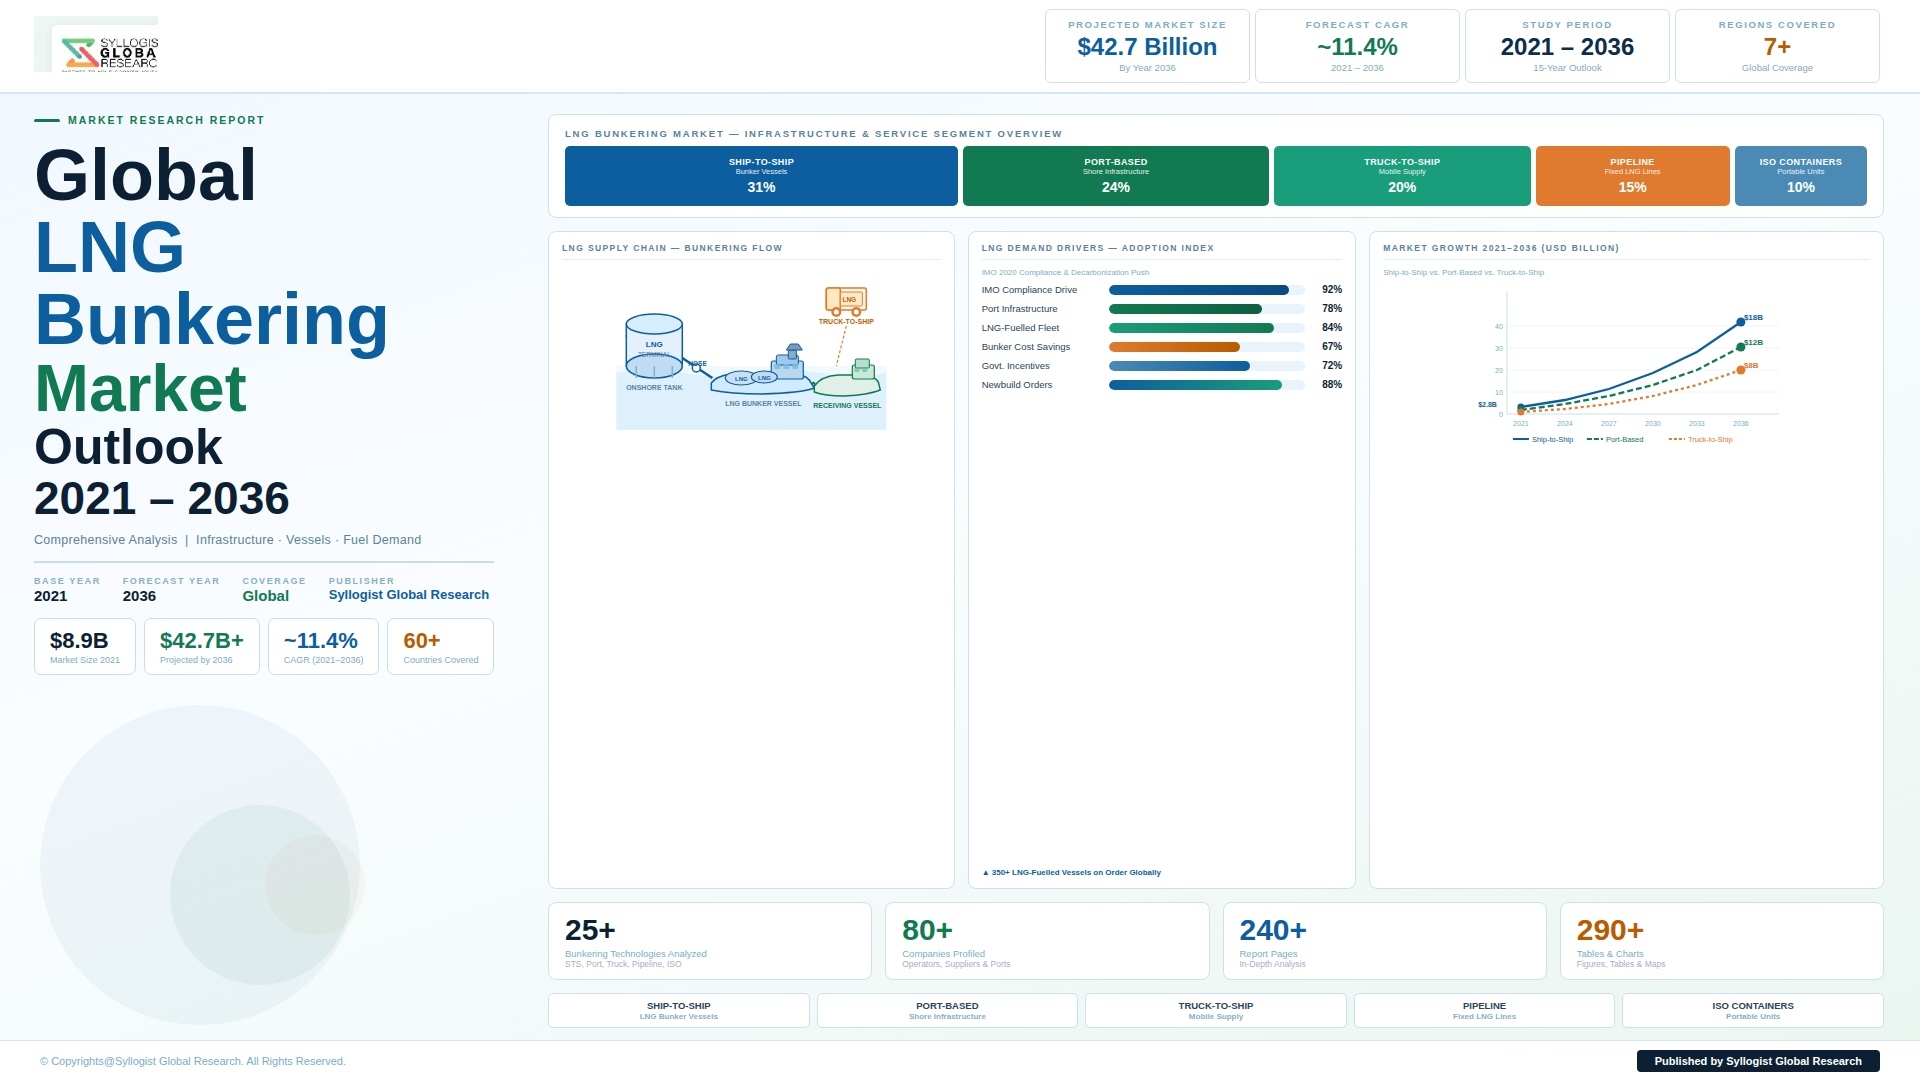
The global LNG bunkering market is positioned at the center of maritime shipping decarbonization as the most commercially scalable and operationally proven alternative marine fuel pathway available to ship operators navigating the International Maritime Organization’s Carbon Intensity Indicator requirements, the 2023 IMO GHG Strategy targeting net-zero greenhouse gas emissions from international shipping by 2050, and the European Union Emissions Trading System extension to maritime transport that took effect in January 2024. The global LNG bunkering market was valued at approximately USD 9.8 billion in 2025 and is projected to reach USD 21.4 billion by 2034, advancing at a compound annual growth rate of 9.1% over the forecast period from 2027 to 2034, driven by the continuing expansion of the LNG-fueled vessel orderbook, the progressive densification of LNG bunkering infrastructure networks across major global port hubs, and the growing volume of LNG fuel offtake commitments secured by major shipping operators under long-term supply agreements with LNG producers and trading companies.
The LNG-fueled vessel fleet has grown from a handful of pioneering ferry and offshore support vessel applications in Norwegian fjord operations to a globally distributed fleet encompassing container ships, bulk carriers, tankers, cruise vessels, roll-on roll-off car carriers, and liquefied gas carriers across all major shipping segments, with LNG-fueled vessel newbuild orders reaching approximately 547 vessels on order or under construction as of the end of 2025, representing a total LNG fuel demand potential of approximately 28.3 million tonnes per year at full fleet deployment. Container shipping has emerged as the single most commercially significant LNG bunkering demand segment, with major container lines including CMA CGM, Hapag-Lloyd, and Evergreen having committed to large LNG dual-fuel newbuild programs that are progressively entering service on high-volume Asia-Europe, Transpacific, and intra-Asian trade lanes served by ports with established or developing LNG bunkering infrastructure. The cruise sector represents the highest per-vessel LNG fuel consumption category, with modern large cruise ships requiring approximately 150 to 200 tonnes of LNG per day of operation and driving substantial LNG bunkering investment at major cruise homeport and turnaround destinations including Rotterdam, Barcelona, Miami, and Singapore.
The LNG bunkering infrastructure landscape has undergone a fundamental transformation from isolated pioneering installations toward an increasingly connected global network of ship-to-ship bunkering vessels, terminal bunkering facilities, and truck-to-ship supply chains that collectively provide LNG fuel access across more than 130 ports globally as of 2025, compared to fewer than 20 ports operational a decade earlier, reflecting the commercial investment response to confirmed LNG-fueled vessel orderbook commitments and the regulatory certainty provided by the IMO IGF Code framework governing LNG marine fuel operations. Ship-to-ship bunkering vessels, which offer the operational flexibility to deliver LNG fuel at anchorage, alongside berth, or in the approaches to major ports without requiring fixed terminal infrastructure investment, have become the dominant bunkering modality at established LNG hub ports including Rotterdam, Singapore, Zeebrugge, and Sines, with the global LNG bunkering vessel fleet reaching approximately 34 purpose-built units in operation as of 2025 with an additional 14 vessels on order. The parallel development of truck-to-ship LNG bunkering supply chains is enabling LNG fuel access at secondary and emerging port locations where dedicated bunkering vessel or terminal investment cannot yet be justified by committed fuel volume, creating a flexible entry-point bunkering infrastructure model that is accelerating geographic network expansion.
From a regional perspective, Europe leads global LNG bunkering market development by both infrastructure maturity and regulatory stimulus, with the North Sea and Baltic Sea Emission Control Areas having driven early LNG adoption in short-sea and ferry shipping since the mid-2010s, and the EU ETS maritime extension now creating a financial incentive for LNG fuel adoption across all vessel classes operating in European waters that is measurable in terms of carbon cost avoidance per tonne of fuel oil equivalent. The port of Rotterdam handled approximately 1.1 million tonnes of LNG bunker fuel deliveries in 2025, consolidating its position as the world’s largest LNG bunkering hub, while the Belgian port of Zeebrugge and Portuguese port of Sines are expanding LNG bunkering terminal capacity to serve deep-sea container and tanker traffic transiting the Northern European range. Asia-Pacific represents the fastest-growing regional LNG bunkering market, with Singapore’s MPA-led LNG bunkering framework attracting six licensed LNG bunker suppliers operating three bunkering vessels and two terminal berths as of 2025, while China’s domestic LNG bunkering network for inland waterway vessels on the Yangtze River system has reached approximately 280 active bunkering stations serving a river vessel LNG-fueled fleet exceeding 6,300 units.
Key Drivers
IMO GHG Strategy and Regional Emission Control Area Regulations Compelling Ship Operators Toward LNG as the Nearest-Term Scalable Compliance Fuel Pathway
The progressive tightening of international and regional maritime emission regulations is creating a durable and expanding commercial imperative for ship operators to adopt LNG as a marine fuel, driven by the IMO’s 2023 Revised GHG Strategy, which mandates a 20% reduction in greenhouse gas emissions from international shipping by 2030 against 2008 levels and net-zero emissions by 2050, alongside the Carbon Intensity Indicator operational rating system that imposes annual efficiency improvement requirements on existing vessels and generates direct financial exposure for operators whose fleets fall below required CII ratings. LNG combustion in certified dual-fuel marine engines delivers approximately 20% to 23% well-to-wake greenhouse gas emission reduction relative to conventional heavy fuel oil combustion on a carbon dioxide equivalent basis, representing the most substantial and immediately deployable emission reduction available to ship operators through fuel switching within existing proven engine technology platforms. The extension of the European Union Emissions Trading System to maritime transport from January 2024, which requires shipping companies to surrender carbon allowances for 100% of emissions from voyages within the European Economic Area and 50% of emissions from voyages entering or departing EEA ports, is creating direct per-voyage carbon cost exposure that quantifiably improves the economics of LNG fuel adoption for vessel operators on high-frequency European trade routes and port call patterns. Sulfur Emission Control Areas in the North Sea, Baltic Sea, North American coastal waters, and the US Caribbean Sea impose a 0.1% sulfur fuel limit that LNG inherently satisfies, eliminating the cost of exhaust gas cleaning system installation or low-sulfur distillate fuel premium for compliant vessel operations within these zones.
Expanding LNG-Fueled Vessel Orderbook Across Container, Cruise, and Tanker Segments Generating Committed Long-Term LNG Bunker Fuel Demand
The accumulation of LNG dual-fuel newbuild vessel commitments across container shipping, cruise, tanker, and bulk carrier segments over the past five years has created a confirmed forward demand pipeline for LNG marine fuel that is providing the commercial volume certainty required to justify bunkering infrastructure investment, long-term LNG supply contracting, and bunkering vessel fleet expansion by terminal operators, energy majors, and independent bunkering service providers. The container shipping segment alone has committed to approximately 270 LNG dual-fuel vessels across newbuild programs at major Korean, Chinese, and European shipyards, representing a combined nominal LNG fuel consumption capacity exceeding 14 million tonnes per year when fully deployed on deep-sea trade routes, and major container lines have secured long-term LNG fuel supply agreements with producers and traders including Shell, TotalEnergies, and ENN Natural Gas to underpin the fuel economics of their LNG fleet programs. The cruise industry has made LNG a cornerstone of its fleet renewal strategy, with the world’s four largest cruise companies by passenger capacity having ordered or taken delivery of LNG dual-fuel cruise ships, driven by LNG’s superior emission compliance credentials in the environmentally sensitive port destinations, coastal cruising areas, and Emission Control Area waters that define the primary itinerary geography of the contemporary cruise industry. The growing orderbook of LNG-fueled very large crude carriers, Aframax tankers, and LPG carriers from major tanker owners and operators reflects the commercial attractiveness of LNG fuel in the tanker segment, where vessel operational profiles favor large-volume LNG bunkering events at a limited number of major loading and discharge port hubs where LNG infrastructure investment can be efficiently concentrated.
Global LNG Supply Abundance and Competitive LNG Marine Fuel Pricing Relative to Alternative Compliance Fuels Supporting LNG Bunkering Economics
The global LNG supply landscape has been fundamentally transformed by the rapid scaling of United States LNG export capacity, the continued expansion of Qatari LNG production, and the development of new LNG export projects across Australia, East Africa, and Southeast Asia, creating a structurally well-supplied global LNG market that supports competitive LNG marine fuel pricing relative to very low sulfur fuel oil and marine gas oil on an energy-equivalent and regulatory compliance-adjusted basis across the major LNG bunkering hub locations. United States LNG export capacity reached approximately 88 million tonnes per year of operational capacity as of the end of 2024, with a further 35 million tonnes per year of capacity under construction or in advanced project development, and the structural growth in Atlantic Basin LNG supply is directly improving LNG bunker fuel availability and pricing competitiveness at European and North American bunkering hubs that were previously more exposed to Pacific Basin LNG market pricing dynamics. The methane slip performance improvements achieved by the latest generation of high-pressure dual-fuel engines, specifically the WinGD X-DF2.0 and MAN B and W ME-GI engine platforms, which reduce unburned methane emissions to levels below 0.1 grams per kilowatt-hour during low-load operation compared to approximately 3 to 5 grams per kilowatt-hour for earlier low-pressure Otto cycle engines, are materially improving the well-to-wake greenhouse gas performance of LNG marine fuel and strengthening the regulatory emission compliance credentials of LNG propulsion relative to alternative fuel pathways.
Key Challenges
Infrastructure Investment Gap and Geographic Concentration of LNG Bunkering Availability Constraining Fleet-Wide LNG Adoption Across Secondary and Emerging Port Locations
Despite the significant progress in LNG bunkering network development achieved across European and major Asian hub ports, the geographic coverage of reliable and commercially competitive LNG bunkering availability remains concentrated in a limited number of established hub locations, creating a critical infrastructure gap that constrains ship operators from committing to LNG propulsion for vessel deployment on trade routes, port rotation patterns, and regional shipping markets where LNG bunkering access cannot be assured with the frequency, volume, and scheduling reliability required to support operational voyage planning. The capital cost of constructing a purpose-built LNG bunkering terminal with 10,000 to 20,000 cubic meters of cryogenic storage capacity, specialist jetty infrastructure, and regulatory-compliant transfer systems ranges from USD 45 million to USD 120 million depending on location, berth configuration, and applicable environmental and safety standards, representing a investment threshold that requires multi-year committed fuel volume offtake agreements from anchor vessel customers before terminal developers can achieve project financing on commercially viable terms. The development of LNG bunkering infrastructure at ports in South America, West Africa, South Asia, and Southeast Asia outside Singapore is proceeding substantially more slowly than the pace of LNG-fueled vessel orderbook growth, creating an emerging mismatch between the global distribution of LNG dual-fuel vessels entering service and the geographic coverage of reliable LNG fuel supply infrastructure that risks creating fuel supply disruption and operational planning complexity for ship operators committing LNG vessels to non-hub trade routes.
Methane Slip Emissions from LNG Marine Engines and the Evolving Regulatory Treatment of Methane as a Greenhouse Gas Undermining LNG Long-Term Decarbonization Credentials
The incomplete combustion of methane in low-pressure Otto cycle dual-fuel marine engines, commonly referred to as methane slip, releases unburned methane directly into the exhaust gas stream and atmosphere, and given that methane carries a global warming potential approximately 80 times greater than carbon dioxide over a 20-year time horizon, methane slip emissions from the existing installed base of earlier-generation LNG dual-fuel engines substantially erode and in some engine-load scenarios completely eliminate the well-to-wake greenhouse gas advantage of LNG combustion relative to conventional heavy fuel oil, creating a regulatory and reputational risk for LNG marine fuel that is becoming increasingly prominent in IMO emissions accounting methodology debates and lifecycle emissions assessment frameworks applied under the EU FuelEU Maritime regulation. The FuelEU Maritime regulation, effective from January 2025, applies a methane global warming potential factor of 82.5 in its well-to-wake greenhouse gas intensity calculation methodology for LNG marine fuel, directly penalizing the greenhouse gas accounting of LNG propulsion based on upstream methane leakage and onboard methane slip estimates in a manner that could render LNG non-compliant with the regulation’s progressively tightening greenhouse gas intensity reduction thresholds beyond the 2035 compliance horizon unless engine methane slip performance continues to improve. While the latest high-pressure dual-fuel engine platforms have demonstrated substantially improved methane slip performance, the majority of the existing LNG-fueled vessel fleet operates earlier-generation low-pressure Otto cycle engines whose methane slip characteristics remain commercially and regulatorily significant, creating an ongoing technical and reputational challenge for the LNG bunkering industry in demonstrating LNG’s long-term greenhouse gas performance credentials.
LNG Price Volatility, Supply Security Uncertainty, and the Bunkering Price Discovery Challenge at Emerging and Secondary Hub Locations
LNG marine fuel pricing is exposed to the price dynamics of the global LNG commodity market, which experienced extraordinary volatility between 2021 and 2023 as European energy security disruption drove TTF and JKM spot LNG prices to unprecedented levels, demonstrating the vulnerability of LNG bunkering economics to upstream LNG commodity market shocks that can rapidly and substantially erode the cost competitiveness of LNG as a marine fuel relative to conventional fuel oil alternatives and create operational and financial planning uncertainty for shipping companies with LNG dual-fuel vessels committed to long-term trade route deployments. The absence of transparent, liquid, and independently verified LNG bunker fuel price benchmarks at secondary and emerging bunkering locations, outside the established major hubs where platforms such as Platts and Argus publish daily LNG bunker price assessments, creates price discovery challenges for ship operators negotiating spot bunkering contracts and for terminal operators structuring offtake agreements, reducing market efficiency and commercial confidence in LNG bunkering procurement at locations where fuel supply market depth is insufficient to support continuous competitive pricing. The logistical complexity of coordinating LNG bunkering supply chains at locations dependent on truck-to-ship delivery from remote LNG import terminals or small-scale liquefaction plants introduces supply scheduling risk, quantity limitation constraints, and delivered cost premiums relative to ship-to-ship bunkering at established hub ports, creating a tiered LNG bunkering market in which fuel cost and availability reliability varies substantially with geographic proximity to major LNG bunkering infrastructure nodes.
Market Segmentation
- Segmentation By Bunkering Mode
- Truck-to-Ship (TTS) LNG Bunkering
- Ship-to-Ship (STS) LNG Bunkering
- Terminal-to-Ship (Port-Based Fixed Infrastructure) LNG Bunkering
- Pipeline-to-Ship LNG Bunkering
- Others
- Segmentation By Vessel Type
- Container Ships and Feeder Vessels
- Cruise Ships and Passenger Ferries
- Tankers (Crude, Product, Chemical, LPG, LNG)
- Bulk Carriers
- Roll-On Roll-Off (RoRo) and Car Carriers
- Offshore Support Vessels and Platform Supply Vessels
- Inland Waterway and River Vessels
- Tugboats and Harbor Craft
- Others
- Segmentation By Storage Infrastructure Type
- Onshore LNG Bunkering Terminals (Large-Scale Storage)
- Small-Scale LNG Satellite Storage Facilities
- Floating Storage and Regasification Units (FSRU) Serving Bunkering
- Mobile and Relocatable LNG Bunkering Units
- Others
- Segmentation By LNG Fuel Application
- Primary LNG-Fueled Propulsion (Mono-Fuel)
- Dual-Fuel LNG and Heavy Fuel Oil Propulsion
- Dual-Fuel LNG and Marine Gas Oil Propulsion
- LNG Auxiliary Power Generation Onboard
- Others
- Segmentation By End User
- Container Shipping Lines
- Cruise and Passenger Ferry Operators
- Tanker Owners and Operators
- Bulk Carrier Operators
- Offshore Energy Sector Fleet Operators
- Inland Waterway Fleet Operators
- Port and Harbor Authorities
- Others
- Segmentation By Supply Source
- LNG Import Terminal-Sourced Bunkering Supply
- Small-Scale Liquefaction Plant-Sourced Bunkering Supply
- LNG Production Facility Direct Supply
- Spot and Short-Term LNG Cargo-Sourced Bunkering Supply
- Others
- Segmentation By Equipment and Technology
- LNG Bunkering Vessels (Purpose-Built)
- Cryogenic Transfer Hoses and Loading Arms
- LNG Fuel Tank Systems (Vessel-Installed)
- Vapor Return and Gas Management Systems
- LNG Metering and Quantity Measurement Systems
- Emergency Shutdown and Safety Systems
- Others
- Segmentation By Service Type
- LNG Fuel Supply and Delivery Services
- LNG Quantity Surveying and Quality Testing Services
- Bunkering Safety Management and Operations Services
- LNG Bunkering Logistics and Scheduling Services
- LNG Bunkering Regulatory Compliance and Certification Services
- Others
- Segmentation By Region
- North America
- Europe
- Asia-Pacific
- Middle East and Africa
- Latin America
All market revenues are presented in USD
Historical Year: 2021-2024 | Base Year: 2025 | Estimated Year: 2026 | Forecast Period: 2027-2034
Key Questions this Study Will Answer
- What is the total global market valuation of the LNG Bunkering Market in the base year 2025, and what is the projected market size and compound annual growth rate through 2034, disaggregated by bunkering mode, vessel type, and region, to enable LNG bunkering terminal operators, energy majors, shipping companies, equipment manufacturers, and infrastructure investors to identify which segments and geographies will generate the highest absolute revenue growth and the most durable LNG fuel demand volumes across the forecast period?
- How is the expanding LNG dual-fuel vessel orderbook across container shipping, cruise, tanker, and bulk carrier segments translating into committed LNG bunker fuel demand volumes at major global hub ports and secondary bunkering locations through 2034, and what is the projected annual LNG bunker fuel consumption by vessel segment, trade route, and geographic region as the LNG-fueled fleet grows toward full deployment on its intended operational trade patterns?
- What is the current geographic coverage and projected expansion trajectory of the global LNG bunkering infrastructure network through 2034, identifying which port locations are expected to develop dedicated ship-to-ship bunkering vessel operations or onshore terminal bunkering facilities, which regions face the most acute infrastructure investment gaps relative to incoming LNG-fueled vessel deployment, and what investment volumes and commercial models are enabling LNG bunkering infrastructure development at emerging hub locations across South America, West Africa, South Asia, and Southeast Asia?
- How are methane slip emission characteristics of installed and newbuild LNG dual-fuel marine engine platforms evolving in response to high-pressure engine technology adoption and aftermarket engine modification programs, and what is the projected well-to-wake greenhouse gas intensity trajectory of LNG marine fuel through 2034 under the FuelEU Maritime regulation calculation methodology, and how does this compare against the greenhouse gas intensity thresholds applicable under progressive FuelEU Maritime compliance periods through 2040 and beyond?
- Who are the leading LNG bunkering terminal operators, purpose-built bunkering vessel owners, LNG marine fuel suppliers, cryogenic equipment manufacturers, and integrated LNG bunkering service providers currently defining the competitive landscape of the global LNG bunkering market, and what are their respective infrastructure portfolios, long-term LNG supply contracting strategies, bunkering vessel fleet expansion programs, geographic market positioning, and competitive differentiation approaches in response to the accelerating growth of LNG bunkering demand across major shipping trade routes?
- Product Definition
- Research Methodology
- Research Design & Framework
- Overall Research Approach: Descriptive, Exploratory & Quantitative Mixed-Method Design
- Market Definition & Scope Boundaries: What is Included and Excluded
- Segmentation Framework
- Key Research Assumptions & Limitations
- Secondary Research
- Primary Research Design & Execution
- Data Triangulation & Validation
- Market Sizing & Forecasting Methodology
- Competitive Intelligence Methodology
- Quality Assurance & Peer Review
- Definitions, Abbreviations & Data Notes
- Research Design & Framework
- Executive Summary
- Market Snapshot & Headline Numbers
- Key Findings & Research Highlights
- Market Dynamics
- Regional Market Summary
- Competitive Landscape Snapshot
- Technology & Innovation Highlights
- Market Dynamics
- Drivers
- Restraints
- Opportunities
- Challenges
- Porter’s Five Forces Analysis
- PESTLE Analysis
- Market Trends & Developments
- Emerging Trends
- Technological Developments
- Regulatory & Policy Changes
- Supply Chain & Sourcing Trends
- Manufacturing & Process Trends
- Investment & Funding Activity
- Sustainability & ESG Trends
- Risk Assessment Framework
- LNG Price Volatility, Feedgas Availability & Supply Security Risk
- Regulatory Uncertainty, IMO Compliance Timeline & Alternative Fuel Competition Risk
- Bunkering Infrastructure Availability, Port Readiness & Operational Safety Risk
- Technology Lock-In, Vessel Retrofit Feasibility & Residual Asset Value Risk
- Financing, Project Development & Stranded Infrastructure Risk
- Regulatory Framework & Standards
- IMO 2020 Sulphur Cap, Carbon Intensity Indicator (CII) & FuelEU Maritime Compliance Frameworks Applicable to LNG Bunkering
- IGF Code, MARPOL Annex VI & ISO 20519 LNG Bunkering Safety & Quality Standards
- National Port Authority Regulations, Bunkering Licensing & Operational Safety Requirements
- Environmental, Methane Slip, GHG Lifecycle Assessment & Emissions Reporting Requirements for LNG Bunkering
- Green Finance, Alternative Fuel Infrastructure (AFIR) Incentives & ESG Disclosure Standards for LNG Bunkering Investment
- Global LNG Bunkering Market Outlook
- Market Size & Forecast by Value
- Market Size & Forecast by Volume (LNG Bunkered, Million Tonnes per Annum)
- Market Size & Forecast by Bunkering Mode
- Ship-to-Ship (STS) Bunkering
- Truck-to-Ship (TTS) Bunkering
- Port-to-Ship / Terminal-to-Ship (PTS) Bunkering via Fixed Jetty or Pipeline
- Container-to-Ship (ISO Tank Trailer & ISO Container) Bunkering
- Market Size & Forecast by Storage & Supply Infrastructure Type
- Floating Storage & Regasification Units (FSRUs) Repurposed for LNG Bunkering
- Dedicated LNG Bunkering Vessels (LBVs)
- Shore-Based LNG Bunkering Terminals & Storage Tanks
- Mobile LNG Bunkering Trailers & ISO Tank Containers
- Small-Scale LNG Satellite Stations & Micro-Distribution Hubs
- Market Size & Forecast by LNG Bunkering Vessel Capacity
- Large-Scale Bunkering Vessels (Above 5,000 m3)
- Medium-Scale Bunkering Vessels (1,000 m3 to 5,000 m3)
- Small-Scale Bunkering Vessels & Barges (Below 1,000 m3)
- Market Size & Forecast by Vessel Type Bunkered
- Container Ships & Box Vessels
- Bulk Carriers & General Cargo Vessels
- Tankers (Crude Oil, Product & Chemical Tankers)
- Cruise Ships & Passenger Ferries
- RoRo & Car Carrier Vessels
- Offshore Support Vessels (OSVs) & Platform Supply Vessels (PSVs)
- LNG Carriers (Boil-Off Gas Utilisation & Dual-Fuel)
- Inland Waterway & Short-Sea Shipping Vessels
- Market Size & Forecast by End-Use Application
- Deep-Sea International Shipping
- Short-Sea & Coastal Shipping
- Inland Waterway Shipping
- Ferry & Passenger Vessel Operations
- Port & Harbour Craft Operations
- Market Size & Forecast by End-User
- Shipping Lines & Fleet Operators
- LNG Bunkering Terminal & Infrastructure Operators
- Port Authorities & Terminal Operators
- Oil & Gas Majors & LNG Aggregators
- Independent LNG Bunkering Service Providers
- Market Size & Forecast by Sales Channel
- Long-Term LNG Supply & Bunkering Service Agreement
- Spot Market & Short-Term LNG Bunkering Contract
- Integrated Port & Bunkering Service Contract
- Third-Party Bunkering Agent & Broker
- North America LNG Bunkering Market Outlook
- Market Size & Forecast
- By Value
- By Volume (LNG Bunkered, Million Tonnes per Annum)
- By Bunkering Mode
- By Storage & Supply Infrastructure Type
- By Vessel Type
- By End-Use Application
- By End-User
- By Country
- By Sales Channel
- Market Size & Forecast
- Europe LNG Bunkering Market Outlook
- Market Size & Forecast
- By Value
- By Volume (LNG Bunkered, Million Tonnes per Annum)
- By Bunkering Mode
- By Storage & Supply Infrastructure Type
- By Vessel Type
- By End-Use Application
- By End-User
- By Country
- By Sales Channel
- Market Size & Forecast
- Asia-Pacific LNG Bunkering Market Outlook
- Market Size & Forecast
- By Value
- By Volume (LNG Bunkered, Million Tonnes per Annum)
- By Bunkering Mode
- By Storage & Supply Infrastructure Type
- By Vessel Type
- By End-Use Application
- By End-User
- By Country
- By Sales Channel
- Market Size & Forecast
- Latin America LNG Bunkering Market Outlook
- Market Size & Forecast
- By Value
- By Volume (LNG Bunkered, Million Tonnes per Annum)
- By Bunkering Mode
- By Storage & Supply Infrastructure Type
- By Vessel Type
- By End-Use Application
- By End-User
- By Country
- By Sales Channel
- Market Size & Forecast
- Middle East & Africa LNG Bunkering Market Outlook
- Market Size & Forecast
- By Value
- By Volume (LNG Bunkered, Million Tonnes per Annum)
- By Bunkering Mode
- By Storage & Supply Infrastructure Type
- By Vessel Type
- By End-Use Application
- By End-User
- By Country
- By Sales Channel
- Market Size & Forecast
- Country-Wise* LNG Bunkering Market Outlook
- Market Size & Forecast
- By Value
- By Volume (LNG Bunkered, Million Tonnes per Annum)
- By Bunkering Mode
- By Storage & Supply Infrastructure Type
- By Vessel Type
- By End-Use Application
- By End-User
- By Country
- By Sales Channel
- Market Size & Forecast
- *Countries Analyzed in the Syllogist Global Research Portfolio: United States, Canada, Mexico, Germany, France, United Kingdom, Netherlands, Spain, Italy, Norway, Sweden, China, Japan, India, Australia, South Korea, Singapore, Brazil, Chile, Saudi Arabia, UAE, Egypt, South Africa, Israel
- Technology Landscape & Innovation Analysis
- LNG Bunkering Vessel Design, Cryogenic System & Cargo Containment Technology Deep-Dive
- Shore-Based LNG Storage Tank, Cryogenic Pump & Vapour Handling Technology
- Ship-to-Ship Bunkering Operations Technology: Hose Systems, Emergency Release Couplings & Metering
- Boil-Off Gas (BOG) Management, Reliquefaction & Vapour Return System Technology
- LNG Dual-Fuel Engine Technology: Two-Stroke & Four-Stroke Engine Platforms
- LNG Bunkering Metering, Custody Transfer & CTMS Technology
- Digital Twin, Fleet Management & LNG Supply Chain Optimisation Platform Technology
- Patent & IP Landscape in LNG Bunkering & Marine LNG Technologies
- Value Chain & Supply Chain Analysis
- LNG Liquefaction, Export Terminal & Feedgas Supply Chain
- LNG Shipping, Small-Scale LNG Carrier & Feeder Vessel Supply Chain
- LNG Bunkering Vessel Construction, Outfitting & Equipment Supply Chain
- Cryogenic Equipment, Storage Tank & Pump Manufacturing Supply Chain
- LNG Bunkering Terminal EPC, Engineering & System Integration Supply Chain
- LNG Bunkering Service Provider, Aggregator & Broker Channel
- Residuals Management, BOG Utilisation & Circular Economy
- Pricing Analysis
- LNG Bunker Fuel Price Benchmarking: HH, TTF, JKM & Oil-Linked Pricing Mechanisms
- LNG Bunkering Infrastructure Capital Cost Analysis: Vessel, Terminal & Shore Tank
- LNG vs. VLSFO, MGO & Alternative Marine Fuel Total Cost of Ownership (TCO) Comparison
- LNG Bunkering Operating Cost, Margin & Service Fee Structure Analysis
- LNG Bunkering Project Finance, Tariff & Revenue Model Analysis
- Total LNG Bunkering Economics: Levelised Cost of Bunkering (LCoB) Analysis
- Sustainability & Environmental Analysis
- Lifecycle Assessment (LCA) of LNG as a Marine Fuel: Well-to-Wake GHG Emissions, Methane Slip & Carbon Footprint
- LNG Bunkering Contribution to IMO 2030 & 2050 GHG Reduction Targets and CII Compliance
- LNG as a Transitional Fuel: Bridging Role Toward Green Methanol, Ammonia & Hydrogen Bunkering
- Environmental Compliance, Air Quality, Sulphur & NOx Reduction Benefits of LNG Bunkering
- Regulatory-Driven Sustainability, SDG 13 (Climate Action) & SDG 14 (Life Below Water) Alignment & Green Finance Eligibility
- Competitive Landscape
- Market Structure & Concentration
- Market Consolidation Level (Fragmented vs. Consolidated by Bunkering Mode & Geography)
- Top 10 Players Market Share
- HHI (Herfindahl-Hirschman Index) Concentration Analysis
- Competitive Intensity Map by Bunkering Mode, Infrastructure Type & Geography
- Player Classification
- Integrated Oil & Gas Majors & LNG Aggregators with Bunkering Operations
- Dedicated LNG Bunkering Vessel Owners & Operators
- LNG Bunkering Terminal & Shore Infrastructure Owners & Operators
- Shipping Lines Operating Own LNG Bunkering Fleets
- Port Authorities & Utility Companies Developing LNG Bunkering Infrastructure
- Small-Scale LNG Distributors, Truck & ISO Container Bunkering Specialists
- Digital Platform, Metering & Custody Transfer Technology Providers
- EPC Contractors & Project Developers Specialising in LNG Bunkering Infrastructure
- Competitive Analysis Frameworks
- Market Share Analysis by Bunkering Mode, Infrastructure Type & Region
- Company Profile
- Company Overview & Headquarters
- LNG Bunkering Products, Vessel Fleet & Infrastructure Portfolio
- Key Customer Relationships & Reference Bunkering Operations
- Bunkering Vessel & Infrastructure Capacity
- Revenue (LNG Bunkering Segment) & Backlog
- Technology Differentiators & IP
- Key Strategic Partnerships, JVs & M&A Activity
- Recent Developments (Contract Wins, Capacity Expansion, New Vessel Orders)
- SWOT Analysis
- Strategic Focus Areas & Roadmap
- Competitive Positioning Map (Infrastructure Scale vs. Geographic Reach)
- Key Company Profiles
- Market Structure & Concentration
- Strategic Opportunity Analysis
- Strategic Output
- Market Opportunity Matrix: By Bunkering Mode, Infrastructure Type, Vessel Type, End-User & Geography
- White Space Opportunity Analysis
- Strategic Recommendations
- Product Portfolio & Technology Investment Strategy
- Manufacturing & Operational Excellence Strategy
- Geographic Expansion & Localisation Strategy
- Customer & End-User Engagement Strategy
- Partnership, M&A & Ecosystem Strategy
- Sustainability & Circular Economy Strategy
- Risk Mitigation & Future Roadmap
- Strategic Priority Matrix & Roadmap
- Near-term (2025-2028)
- Mid-term (2029-2032)
- Long-term (2033-2037)
- Strategic Output