Global Shale Gas Service Market By Service Type, By Well Type, By Technology, By Fleet Type, By Operator Type, By Basin, By End User, By Region, Competition, Forecast & Opportunities, 2021-2036F
Market Definition
The Global Shale Gas Service Market encompasses the engineering, supply, execution, and lifecycle management of specialized oilfield services dedicated to the exploration, drilling, completion, stimulation, production, and intervention of unconventional shale gas wells across recognized commercial basins worldwide. The market includes directional and horizontal drilling services using rotary steerable systems, measurement-while-drilling and logging-while-drilling tools, mud motors, and managed pressure drilling packages; hydraulic fracturing services covering high-horsepower frac pumping fleets, blender and hydration units, frac sand and proppant logistics, water sourcing and recycling, friction reducers, slickwater and gel chemistry, and microseismic monitoring; well completion services including cementing, casing running, plug-and-perf operations, sliding sleeve completions, multi-stage completion tools, and wireline perforation; production services including artificial lift design and installation across electric submersible pumps, gas lift, and plunger lift, gathering system tie-in, separation, and flowback management; and intervention and workover services including coiled tubing, snubbing, fishing, and refrac operations. Within scope are integrated project management contracts, pad-scale simul-frac and trimul-frac execution programs, electric and dual-fuel frac fleet deployment, real-time completion optimization software, and the digital, automation, and emissions monitoring services that surround field operations. End users include integrated oil and gas majors, national oil companies, independent shale operators, midstream-integrated producers, and joint venture entities across commercial shale basins including the Marcellus, Haynesville, Eagle Ford, Permian, Utica, Vaca Muerta, Sichuan, and Bowland plays. For this study, the market is measured by service revenue, equipment day rate income, and aftermarket lifecycle revenue in USD across active drilling, completion, and production operations.
Market Insights
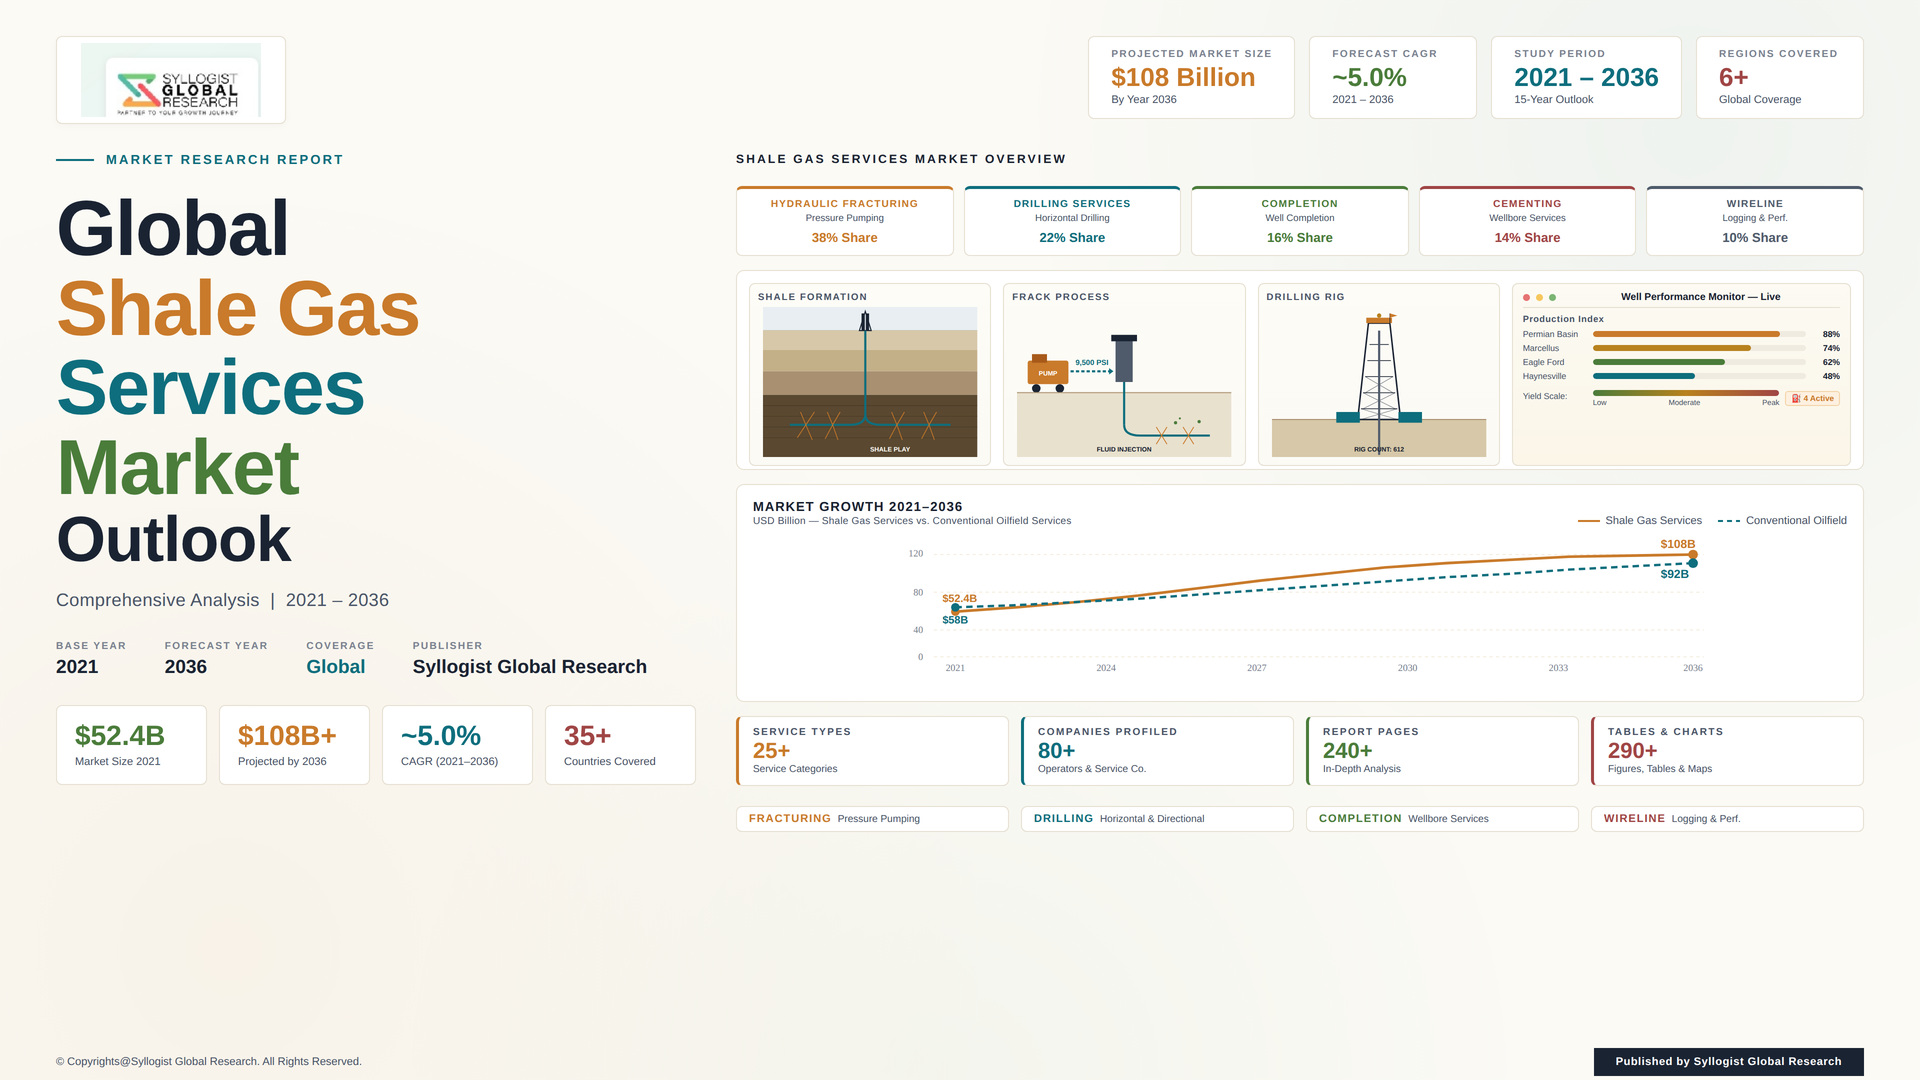
The global shale gas service market is moving through a structurally distinct investment cycle anchored by the unprecedented US LNG export buildout, accelerating AI data center gas-fired power demand, Argentina’s Vaca Muerta development ramp, and the continued scale-up of China’s domestic shale program. The market was valued at approximately USD 54.6 billion in 2025 and is projected to reach USD 86.4 billion by 2034, advancing at a compound annual growth rate of 5.2% through the forecast period, as operators rebalance capital from oil-weighted basins to gas-weighted Marcellus, Haynesville, and Vaca Muerta plays and bring electric and dual-fuel frac fleet capacity online. Hydraulic fracturing services account for the largest revenue category at 41% of total service spend, followed by drilling services at 26%, well completion services at 14%, production services at 11%, and intervention, workover, and refrac services at 8%.
The United States remains the structural anchor of the market, accounting for 71% of global shale gas service revenue, with Lower 48 dry gas production of approximately 105 bcf per day in 2024 of which 82% originates from shale plays. The Marcellus produced 36 bcf per day, the Haynesville 16 bcf per day, the Permian associated gas 24 bcf per day, the Eagle Ford 7.4 bcf per day, and the Utica 3.6 bcf per day. The US LNG export complex on the Gulf Coast is adding 96 mtpa of liquefaction capacity through 2028, equivalent to incremental gas feedstock demand of 13 bcf per day, anchoring a continuous demand pull on Haynesville, Marcellus, and Eagle Ford drilling and completion programs. Average Haynesville lateral lengths have extended to 9,600 feet, frac stages per well have crossed 64, and average proppant intensity has reached 3,800 pounds per lateral foot, all elevating service intensity per well even as well count growth moderates.
Operational efficiency has redefined service economics across the market. Simul-frac, in which two wells are stimulated simultaneously from one pad with a shared frac fleet, now accounts for 38% of active US frac operations, while trimul-frac on three wells in parallel has emerged in the Permian and Haynesville and is reducing pad cycle time by 35% versus zipper frac baselines. Electric and dual-fuel frac fleets, powered by field gas, grid power, or modular natural gas turbines, have grown to 28% of the active US frac fleet in 2025 and are projected to exceed 45% by 2028, supported by 18% lower emissions, reduced diesel logistics, and 22% lower operating cost per stage. Liberty Energy, ProPetro, NexTier, Halliburton, and Patterson-UTI have committed cumulative capex of USD 5.4 billion to electric fleet conversions through 2027.
International shale development is reshaping regional service demand profiles. Argentina’s Vaca Muerta gas production reached 84 mcm per day at the end of 2024, with YPF, Tecpetrol, Pan American Energy, Shell, Vista, and Pluspetrol committing combined capex of USD 24 billion through 2030 to scale Vaca Muerta dry gas output toward 200 mcm per day, supported by the under-construction Nestor Kirchner pipeline reversal and the planned 14 mtpa Vaca Muerta LNG export project sanctioned in 2024. China’s domestic shale gas production reached 25.4 bcm in 2024 across the Fuling, Changning-Weiyuan, and Sichuan plays, with Sinopec, PetroChina, and CNOOC targeting 60 bcm by 2030. The competitive landscape spans integrated service majors including SLB, Halliburton, and Baker Hughes, pureplay frac specialists including Liberty, ProPetro, NexTier, and Patterson-UTI, regional players including BJ Services, RPC, and ChampionX, and Chinese and Argentine national service champions, with the top 10 vendors accounting for 67% of global revenue.
Key Drivers
US LNG Export Capacity Buildout, AI-Led Gas-Fired Power Demand, and Sustained Haynesville and Marcellus Drilling Programs Anchoring Multi-Year Service Demand
The structural expansion of US LNG liquefaction capacity by 96 mtpa through 2028 along the Gulf Coast, combined with AI data center gas-fired power demand projected to add 16 bcf per day of incremental gas consumption by 2030, is anchoring a multi-year drilling and completion services orderbook across the Haynesville, Marcellus, and Eagle Ford plays. Operators including Expand Energy, EQT, Comstock, Range Resources, and Antero Resources have committed combined 2025 capex of USD 14.6 billion to gas-weighted programs, generating sustained demand for high-horsepower frac fleets, directional drilling, completion tools, and gathering system tie-in services.
Electric Frac Fleet Transition, Simul-Frac and Trimul-Frac Adoption, and Emissions-Driven Service Differentiation Reshaping Service Provider Capex Allocation
Electric and dual-fuel frac fleets have crossed 28% of active US capacity in 2025 and are projected to exceed 45% by 2028, with simul-frac now accounting for 38% of active operations and trimul-frac emerging across the Permian and Haynesville. Liberty Energy, ProPetro, NexTier, Halliburton, and Patterson-UTI have committed cumulative capex of USD 5.4 billion to electric fleet conversion through 2027, while service contracts are increasingly being awarded on the basis of emissions intensity, fuel substitution, and pad cycle efficiency, creating durable demand for next-generation fleet platforms.
Vaca Muerta Acceleration, Chinese Shale Program Scale-Up, and International Basin Development Diversifying Global Service Revenue Beyond the US Lower 48
Argentina’s Vaca Muerta is on track to scale gas production from 84 mcm per day at end-2024 to 200 mcm per day by 2030, supported by combined operator capex of USD 24 billion and the under-construction LNG export terminal sanctioned in 2024. China’s domestic shale gas production reached 25.4 bcm in 2024 with a 60 bcm target by 2030, while emerging programs in Algeria, Saudi Arabia, the UAE, and Australia are creating incremental international demand for shale-experienced drilling, completion, and intervention service providers.
Key Challenges
Henry Hub Gas Price Volatility, Operator Capex Discipline, and Service Pricing Compression During Soft Cycles Limiting Margin Recovery
Henry Hub gas prices ranging between USD 1.9 and USD 13.5 per MMBtu over the last three years have driven counter-cyclical operator capex discipline that materially compresses service pricing during soft gas price environments. Haynesville rig count fell 37% during the 2024 price weakness before recovering with the LNG demand outlook, and frac fleet utilization can swing 20 percentage points within a single quarter. Service providers face structural pricing pressure from operator consolidation, with the top 12 producers controlling 64% of Lower 48 gas activity and exerting concentrated bargaining power on service contract terms.
Methane Emissions Regulation, Water Sourcing and Disposal Constraints, and Local Permitting Friction Increasing Operating Costs and Compliance Burden
The EPA Subpart W methane fee escalating to USD 1,500 per ton in 2026, EU methane regulation phase-in, and tightening state-level disclosure regimes are elevating compliance costs across drilling, completion, and production operations. Produced water disposal in the Permian and Eagle Ford has hit injection capacity constraints, with disposal costs rising 41% in 2024 and inducing operators to invest in water recycling facilities and beneficial reuse partnerships. Local permitting friction, particularly in Argentina’s Neuquen province and Chinese Sichuan basins, is extending well permit cycles.
Long-Term Energy Transition Demand Uncertainty, Investor ESG Pressure, and Stranded Service Capacity Risk Constraining Long-Cycle Service Capex
Investor scrutiny of long-cycle hydrocarbon services, the structural uncertainty around long-term gas demand under accelerated decarbonization pathways, and stranded asset risk for frac fleets and drilling rigs are constraining service provider willingness to commit to multi-decade capex programs. Service companies face cost-of-capital escalation as banks apply ESG screens to oilfield services, particularly in Europe, while equity multiples have compressed materially, slowing fleet renewal and shifting capital toward services compatible with low-carbon end-markets including geothermal drilling, CCS injection, and lithium brine extraction.
Market Segmentation
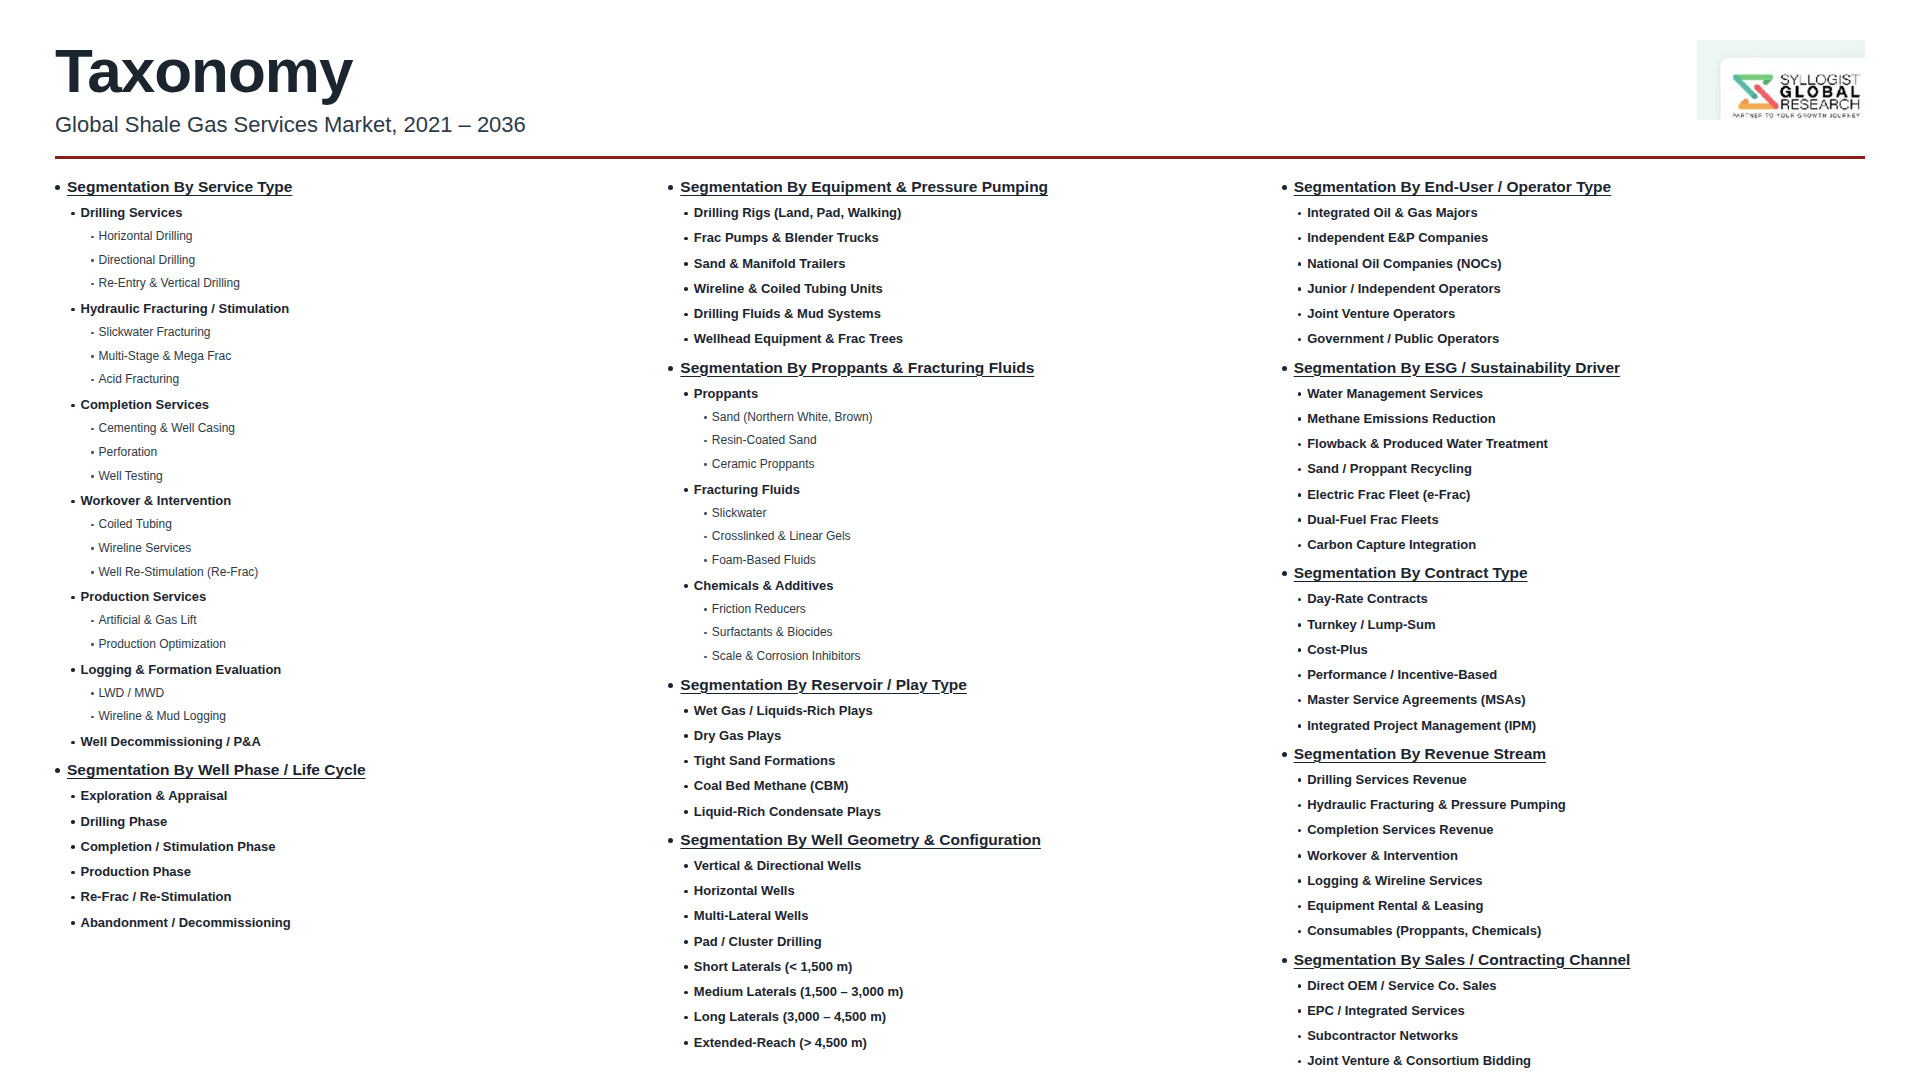
- Segmentation By Service Type
- Drilling Services (Directional, Horizontal, MWD, LWD, Rotary Steerable)
- Hydraulic Fracturing and Stimulation Services
- Well Completion Services (Cementing, Casing, Perforation, Plug-and-Perf)
- Production Services (Artificial Lift, Gathering, Separation)
- Intervention and Workover (Coiled Tubing, Snubbing, Fishing, Refrac)
- Wireline and Logging Services
- Water Management and Recycling Services
- Proppant and Frac Sand Logistics
- Others
- Segmentation By Well Type
- Vertical Wells
- Horizontal Wells
- Multi-Lateral Wells
- Refrac Candidates and Existing Well Recompletion
- Segmentation By Technology
- Conventional Diesel Frac Fleets
- Dual-Fuel Frac Fleets
- Electric Frac Fleets (eFleet)
- Simul-Frac Operations
- Trimul-Frac Operations
- Microseismic Monitoring
- Real-Time Completion Optimization
- Closed-Loop Water Recycling
- Others
- Segmentation By Fleet Type
- Conventional Diesel Pumping Fleets
- Dual-Fuel Fleets
- Tier 4 Dynamic Gas Blending Fleets
- Electric Frac Fleets (Grid, Field Gas, Modular Turbine)
- Hybrid Fleets
- Segmentation By Operator Type
- Integrated Oil and Gas Majors
- National Oil Companies
- Independent Shale Operators
- Midstream-Integrated Producers
- Joint Venture Entities
- Others
- Segmentation By Basin
- Marcellu
- Haynesville
- Eagle Ford
- Permian
- Utica
- Vaca Muerta
- Sichuan (Fuling, Changning-Weiyuan)
- Bowland
- Cooper Basin
- Other International Basins
- Segmentation By End User
- Integrated Oil and Gas Majors
- National Oil Companies
- Independent E&P Operators
- Midstream-Integrated Producers
- LNG Project Developers
- Joint Venture Operators
- Others
- Segmentation By Region
- North America
- Latin America
- Asia-Pacific
- Europe
- Middle East and Africa
All market revenues are presented in USD
Historical Year: 2021-2024 | Base Year: 2025 | Estimated Year: 2026 | Forecast Period: 2027-2034
Key Questions this Study Will Answer
- What is the total global market valuation of the Shale Gas Service Market in 2025, projected through 2034, disaggregated by service type, technology, fleet type, basin, and end user, enabling oilfield service majors, independent service specialists, EPC contractors, E&P operators, and infrastructure investors to identify the highest-growth segments and most durable revenue opportunities across the shale gas services landscape?
- How are leading shale gas basins including the Marcellus, Haynesville, Eagle Ford, Permian, Utica, Vaca Muerta, Sichuan, Bowland, and Cooper Basin allocating capital across drilling, hydraulic fracturing, completion, production, and intervention services, and which basin-level operator capex programs are setting the technical, fleet, and procurement benchmarks shaping the global shale gas service market through 2034?
- What are the relative performance, emissions, cost-per-stage, and operating efficiency advantages of conventional diesel, dual-fuel, Tier 4 dynamic gas blending, electric, and hybrid frac fleets across simul-frac, trimul-frac, zipper frac, and refrac applications, and which fleet architectures and technology platforms are most likely to capture incremental share between 2025 and 2034?
- Which service segments, including high-horsepower frac fleets, directional drilling, multi-stage completions, water recycling, real-time completion optimization, refrac, and integrated project management, are generating the highest growth rates through 2034, and what fleet specifications, automation, and emissions reduction technologies are most critical to service provider competitive positioning in each category?
- How is the competitive landscape structured among integrated service majors including SLB, Halliburton, and Baker Hughes, pureplay frac specialists including Liberty Energy, ProPetro, NexTier, and Patterson-UTI, regional players including BJ Services, RPC, and ChampionX, and Chinese and Argentine national service champions, and what partnership, acquisition, fleet conversion, and platformization strategies are enabling new entrants to compete in next-generation shale gas service programs?
- What are the most significant Henry Hub gas price volatility, operator capex discipline, methane fee escalation, produced water disposal capacity, local permitting friction, and ESG financing risks affecting shale gas service deployments, and how are service providers, E&P operators, regulators, and financiers addressing emissions reduction, water management, fleet flexibility, and risk allocation within evolving shale service frameworks?
- Which regional shale gas service markets, specifically North America, Latin America, Asia Pacific, Europe, and the Middle East and Africa, are expected to generate the most substantial incremental service spending through 2034, and what regulatory frameworks, LNG export licensing regimes, methane regulation, water sourcing and disposal policies, and national shale development plans are driving service provider footprint expansion and supplier selection in each regional market?
- Product Definition
- Research Methodology
- Research Design & Framework
- Overall Research Approach: Descriptive, Exploratory & Quantitative Mixed-Method Design
- Market Definition & Scope Boundaries: What is Included and Excluded
- Segmentation Framework
- Key Research Assumptions & Limitations
- Secondary Research
- Primary Research Design & Execution
- Data Triangulation & Validation
- Market Sizing & Forecasting Methodology
- Competitive Intelligence Methodology
- Quality Assurance & Peer Review
- Definitions, Abbreviations & Data Notes
- Research Design & Framework
- Executive Summary
- Market Snapshot & Headline Numbers
- Key Findings & Research Highlights
- Market Dynamics
- Regional Market Summary
- Competitive Landscape Snapshot
- Technology & Innovation Highlights
- Market Dynamics
- Drivers
- Restraints
- Opportunities
- Challenges
- Porter’s Five Forces Analysis
- PESTLE Analysis
- Market Trends & Developments
- Emerging Trends
- Technological Developments
- Regulatory & Policy Changes
- Frac Fleet, Drilling Rig & Service Capacity Sourcing Trends
- Proppant, Sand Logistics & Last-Mile Supply Trends
- Investment, Shale Activity Pipeline & E&P Capital Discipline Trends
- Sustainability & ESG Trends
- Risk Assessment Framework
- Commodity Price Volatility, Hydrocarbon Price Cycle & E&P Activity Level Risk
- Frac Spread, Drilling Rig Availability, Capital Discipline & Service Inflation Risk
- Regulatory, Permitting, Hydraulic Fracturing Ban & Cross-Jurisdictional Compliance Risk
- HSE, Induced Seismicity, Methane Leakage, Water Contamination & Operational Safety Risk
- Energy Transition, Stranded Capacity, ESG Capital Withdrawal & Long-Term Demand Risk
- Regulatory Framework & Standards
- National Upstream Hydrocarbon Codes, Mineral Rights, Lease Terms & Shale Development Frameworks
- API Standards (API RP 53, RP 90, RP 100, Spec 6A, Spec 5CT), ASME Pressure Vessel Codes & Industry Engineering Codes for Shale Services
- Hydraulic Fracturing Chemical Disclosure (FracFocus), Frac Reporting & State-Level Oil & Gas Regulator Frameworks
- Methane Emissions Regulations (EPA NSPS OOOO / OOOOa / OOOOb, EU Methane Regulation, MiQ Certification, IEA Global Methane Pledge)
- Water Use, Produced Water Disposal, Induced Seismicity, ESG Disclosure & Sustainable Finance Frameworks for Shale Service Operations
- Global Shale Gas Services Market Outlook
- Market Size & Forecast by Value
- Market Size & Forecast by Volume (Number of Wells Drilled & Completed & Frac Stages Pumped)
- Market Size & Forecast by Service Type
- Drilling Services (Horizontal, Directional & Rig Operations)
- Hydraulic Fracturing & Pressure Pumping Services
- Proppant Supply & Sand Logistics Services
- Completion Equipment, Frac Tree & Wellhead Services
- Wireline, Logging & Geophysical Services
- Coiled Tubing, Snubbing & Well Intervention Services
- Cementing, Casing & Tubular Services
- Drilling & Completion Fluids / Mud Services
- Water Management, Frac Flowback & Produced Water Services
- Production, Artificial Lift & Well Optimisation Services
- Refracturing & Production Re-Stimulation Services
- Decommissioning, Plugging & Abandonment (P&A) Services
- Market Size & Forecast by Service Technology
- Slickwater Fracturing Technology
- Hybrid & Cross-Linked Gel Fracturing Technology
- Foam Fracturing (CO2, N2) & Energised Fluid Technology
- Waterless & Gel-Based Fracturing Technology
- LNG / Dual-Fuel & Electric Fracturing (e-Frac, Tier 4 DGB) Technology
- Rotary Steerable Systems (RSS) & Advanced Directional Drilling Technology
- Measurement-While-Drilling (MWD), Logging-While-Drilling (LWD) & Geosteering Technology
- Multi-Pad, Walking Rig & Continuous Drilling Technology
- Electric Drilling Rig & Highline Power Technology
- Multi-Stage Plug & Perf, Sliding Sleeve & Specialty Completion Technology
- AI / ML, Big Data, Digital Twin & Completion Optimisation Technology
- Market Size & Forecast by Well Type & Profile
- Standard Horizontal Wells (5,000 to 10,000 ft Lateral)
- Deep Horizontal Wells (10,000 to 15,000 ft Lateral)
- Ultra-Long Lateral Wells (Above 15,000 ft Lateral)
- Multi-Lateral & Branch Wells
- Vertical & Re-Entry Wells
- Market Size & Forecast by Project Scale & Pad Development
- Mega-Pad & Multi-Well Pad Development (10+ Wells per Pad)
- Large-Scale Multi-Well Programmes (5 to 10 Wells per Pad)
- Mid-Scale Pad Programmes (2 to 5 Wells per Pad)
- Single-Well Exploration & Appraisal Programmes
- Market Size & Forecast by Application & Service Phase
- Exploration & Appraisal Services
- Drilling Phase Services
- Completion & Hydraulic Fracturing Phase Services
- Production & Operations Phase Services
- Workover, Refrac & Production Optimisation Services
- Decommissioning, Plugging & Abandonment & Site Restoration Services
- Market Size & Forecast by End-User
- Independent Shale Operators (Pure-Play E&P Companies)
- Integrated Major Oil & Gas Companies
- National Oil Companies (NOCs)
- Private Equity Backed Shale Operators
- Joint Ventures & Resource Authority-Operated Programmes
- Mid-Cap Independent Producers
- Market Size & Forecast by Sales Channel & Contract Type
- Direct Per-Job & Day Rate Contract
- Master Service Agreement (MSA) & Framework Contract
- Bundled & Integrated Service Contract
- Performance-Based & Risk-Sharing Contract
- Long-Term Strategic Alliance & Dedicated Fleet Contract
- Spot Market & Short-Term Contract
- North America Shale Gas Services Market Outlook
- Market Size & Forecast
- By Value
- By Volume (Number of Wells Drilled & Completed & Frac Stages Pumped)
- By Service Type
- By Service Technology
- By Well Type & Profile
- By Project Scale & Pad Development
- By Application & Service Phase
- By End-User
- By Country
- By Sales Channel & Contract Type
- Europe Shale Gas Services Market Outlook
- Market Size & Forecast
- By Value
- By Volume (Number of Wells Drilled & Completed & Frac Stages Pumped)
- By Service Type
- By Service Technology
- By Well Type & Profile
- By Project Scale & Pad Development
- By Application & Service Phase
- By End-User
- By Country
- By Sales Channel & Contract Type
- Asia-Pacific Shale Gas Services Market Outlook
- Market Size & Forecast
- By Value
- By Volume (Number of Wells Drilled & Completed & Frac Stages Pumped)
- By Service Type
- By Service Technology
- By Well Type & Profile
- By Project Scale & Pad Development
- By Application & Service Phase
- By End-User
- By Country
- By Sales Channel & Contract Type
- Latin America Shale Gas Services Market Outlook
- Market Size & Forecast
- By Value
- By Volume (Number of Wells Drilled & Completed & Frac Stages Pumped)
- By Service Type
- By Service Technology
- By Well Type & Profile
- By Project Scale & Pad Development
- By Application & Service Phase
- By End-User
- By Country
- By Sales Channel & Contract Type
- Middle East & Africa Shale Gas Services Market Outlook
- Market Size & Forecast
- By Value
- By Volume (Number of Wells Drilled & Completed & Frac Stages Pumped)
- By Service Type
- By Service Technology
- By Well Type & Profile
- By Project Scale & Pad Development
- By Application & Service Phase
- By End-User
- By Country
- By Sales Channel & Contract Type
- Country-Wise* Shale Gas Services Market Outlook
- Market Size & Forecast
- By Value
- By Volume (Number of Wells Drilled & Completed & Frac Stages Pumped)
- By Service Type
- By Service Technology
- By Well Type & Profile
- By Project Scale & Pad Development
- By Application & Service Phase
- By End-User
- By Country
- By Sales Channel & Contract Type
- *Countries Analyzed in the Syllogist Global Research Portfolio: United States, Canada, Mexico, Germany, France, United Kingdom, Netherlands, Spain, Italy, Norway, Sweden, China, Japan, India, Australia, South Korea, Singapore, Brazil, Chile, Saudi Arabia, UAE, Egypt, South Africa, Israel
- Technology Landscape & Innovation Analysis
- Horizontal Drilling, Rotary Steerable & Advanced Directional Technology Deep-Dive
- Hydraulic Fracturing & Pressure Pumping Fleet Technology (Conventional Diesel, Tier 4 Dual-Fuel DGB, Electric e-Frac)
- Fracturing Fluid Chemistry Technology (Slickwater, Cross-Linked Gel, Foam, Waterless)
- Proppant (Northern White Sand, In-Basin Sand, Resin-Coated, Ceramic) & Sand Logistics Innovation
- MWD, LWD, Geosteering & Real-Time Drilling Optimisation Technology
- Multi-Pad, Walking Rig & Highline-Powered Continuous Drilling Technology
- Refracturing, Production Re-Stimulation & Well Revitalisation Technology
- Water Management, Frac Flowback Treatment & Produced Water Recycling Technology
- Artificial Intelligence, Machine Learning, Big Data, Digital Twin & Completion Optimisation Technology
- Patent & IP Landscape in Shale Gas Service Technologies
- Value Chain & Supply Chain Analysis
- Land Drilling Rig Contractor Landscape
- Pressure Pumping & Hydraulic Fracturing Service Provider Landscape
- Proppant Producer, Sand Miner & Last-Mile Logistics Provider Landscape
- Wireline, Logging, Coiled Tubing & Well Intervention Specialist Landscape
- Cementing, Casing, Tubular & Drilling Fluid Service Provider Landscape
- Water Management, Produced Water Disposal, Treatment & Recycling Service Provider Landscape
- Equipment OEM (Rigs, Frac Spreads, Wellheads, Pumps, Specialty Tools) Supply Chain
- Independent E&P, Major, NOC & Private Equity Operator Customer Procurement Channel
- Production Operations, Workover & Lifecycle Service Provider Channel
- Pricing Analysis
- Drilling Day Rate & Per-Foot Drilling Cost Analysis Across Rig Tiers (Tier 1 Super-Spec, Tier 2, Legacy)
- Hydraulic Fracturing Per-Stage, Per-Well & Per-Lateral-Foot Service Pricing Analysis
- Proppant Per-Tonne & Sand Logistics (Last-Mile) Pricing Analysis
- Wireline, Logging, Coiled Tubing & Well Intervention Service Pricing Analysis
- Water Management, Produced Water Disposal & Recycling Service Pricing Analysis
- Bundled & Integrated Service Contract & Master Service Agreement Pricing Analysis
- Service Cost Per Lateral Foot, Per Well & Per Frac Stage Benchmark Analysis
- Service Inflation, Equipment Utilisation, Spare Capacity & Margin Analysis
- Sustainability & Environmental Analysis
- Methane Emissions, Fugitive Leakage & Greenhouse Gas Performance of Modern Shale Gas Service Operations
- Electrification of Drilling Rigs & Frac Fleets (e-Frac, Dual-Fuel, Highline Power) & Decarbonisation Pathways
- Water Use, Produced Water Recycling, Frac Flowback Treatment & Water Stewardship Considerations
- Induced Seismicity, Subsurface Containment, Land Use & Local Environmental Impact Considerations
- Alignment of Shale Gas Services with Energy Transition, IEA Global Methane Pledge, MiQ Certification, SDG 13 (Climate Action) & Sustainable Finance Eligibility
- Competitive Landscape
- Market Structure & Concentration
- Market Consolidation Level (Fragmented vs. Consolidated by Service Type & Geography)
- Top 10 Players Market Share
- HHI (Herfindahl-Hirschman Index) Concentration Analysis
- Competitive Intensity Map by Service Type, Service Technology & Geography
- Player Classification
- Integrated Global Oilfield Services Majors (Big 4 OFS)
- Pure-Play Pressure Pumping & Hydraulic Fracturing Specialists
- Land Drilling Rig Contractor Specialists
- Wireline, Logging & Coiled Tubing Specialists
- Proppant Producers, Sand Miners & In-Basin Sand Suppliers
- Water Management, Frac Flowback & Produced Water Specialists
- Specialty Completion, Multi-Stage Frac & Plug & Perf Technology Specialists
- Equipment OEMs (Frac Spreads, Wellheads, Pumps) & Manufacturing-Linked Service Providers
- Decommissioning, P&A & Site Restoration Service Specialists
- Competitive Analysis Frameworks
- Market Share Analysis by Service Type, Service Technology & Region
- Company Profile
- Company Overview & Headquarters
- Shale Gas Service Portfolio, Technology Capability & Fleet Composition
- Key Customer Relationships & Reference E&P Operator Engagements
- Service Footprint, Basin Coverage & Operational Capacity
- Revenue (Shale Gas Services Segment) & Backlog
- Technology Differentiators & IP
- Key Strategic Partnerships, JVs & M&A Activity
- Recent Developments (Fleet Modernisation, e-Frac Conversions, Contract Wins)
- SWOT Analysis
- Strategic Focus Areas & Roadmap
- Competitive Positioning Map (Service Capability vs. Market Penetration)
- Key Company Profiles
- Market Structure & Concentration
- Technology Landscape & Innovation Analysis
- Strategic Output
- Market Opportunity Matrix: By Service Type, Service Technology, Application, End-User & Geography
- White Space Opportunity Analysis
- Strategic Recommendations
- Service Portfolio & Technology Investment Strategy
- Frac Fleet Modernisation, Electrification & Operational Excellence Strategy
- Geographic Expansion & Basin-Specific Strategy (Marcellus, Permian, Haynesville, Vaca Muerta, Sichuan)
- Customer & End-User Engagement Strategy (Independent, Major, NOC, Private Equity)
- Partnership, Vertical Integration & M&A Strategy
- Sustainability, Methane Reduction & ESG-Aligned Service Strategy
- Risk Mitigation & Future Roadmap
- Strategic Priority Matrix & Roadmap
- Near-term (2025-2028)
- Mid-term (2029-2032)
- Long-term (2033-2037)
- Market Size & Forecast
- Market Size & Forecast
- Market Size & Forecast
- Market Size & Forecast
- Market Size & Forecast
- Market Size & Forecast