
Market Definition
The India City Gas Distribution (CGD) market encompasses the development, ownership, operation, and commercialization of natural gas pipeline infrastructure and retail distribution networks within licensed geographical areas (GAs) spanning urban, semi-urban, and peri-urban centers across the country. The market encompasses the transmission of piped natural gas (PNG) to residential households, commercial establishments, industrial consumers, and compressed natural gas (CNG) dispensing outlets serving the transportation sector. CGD networks operate under a licensed regulatory framework administered by the Petroleum and Natural Gas Regulatory Board (PNGRB), which grants authorized entities exclusive rights to develop and monetize city-level gas distribution infrastructure within defined GAs for a prescribed exclusivity period. The value chain spans gas procurement from domestic producers and liquefied natural gas (LNG) importers, regasification and national pipeline grid transmission, pressure reduction through city gate stations, and last-mile distribution through steel and high-density polyethylene (HDPE) pipeline networks to end consumers. Natural gas supplied through India’s CGD networks is sourced from a combination of domestically allocated gas at administered prices and regasified liquefied natural gas (RLNG) procured from international markets, with domestic gas allocation extended on a priority basis to household PNG and CNG consumers. End-use consumption spans residential piped natural gas for cooking and water heating, commercial PNG for hotels, restaurants, and institutions, industrial PNG for manufacturing and process heating, and CNG dispensed at company-operated and dealer-operated stations for vehicular use. The CGD sector represents a strategically vital pillar of India’s broader energy transition agenda, positioned at the intersection of the government’s energy security objectives, urban air quality imperatives, and the national target of scaling natural gas’s contribution in the primary energy mix to 15% by 2030.
Market Insights
India’s CGD sector has undergone a transformational expansion over the past decade, driven by successive PNGRB-administered geographical area authorization rounds that have progressively extended the licensed CGD network to cover more than 630 geographical areas encompassing nearly the entire population and geographic territory of the country. As of 2026, cumulative capital invested in CGD network infrastructure has reached approximately USD 12.4 billion, with annual capital expenditure sustaining an upward trajectory as authorized entities accelerate execution of minimum work programme commitments across newly licensed geographies. The sector recorded estimated revenues of approximately USD 9.8 billion in 2025, underpinned by strong CNG volume growth in the transportation segment, a rapidly expanding household PNG connection base that has surpassed 14.5 million active connections, and deepening industrial PNG penetration across key manufacturing clusters. These fundamentals collectively position India’s CGD market as one of the fastest-growing natural gas distribution sectors in the Asia-Pacific region, with double-digit compound annual growth projected through 2030 as newly authorized GAs progress from infrastructure build-out to active consumer acquisition and volume ramp-up phases.
The vehicular CNG segment constitutes the dominant volume driver within India’s CGD ecosystem, accounting for approximately 60% of total CGD gas consumption as of 2025, and remains the primary revenue and cash flow anchor for CGD entities across established geographical areas. India’s active CNG vehicle population has exceeded 7.2 million units, with original equipment manufacturers across the passenger vehicle, commercial vehicle, and three-wheeler segments increasingly standardizing factory-fitted CNG offerings as a core product strategy in response to structurally persistent fuel price differentials. On a per-kilometer operating cost basis, CNG continues to deliver savings of approximately 45% to 60% relative to petrol for equivalent distances, an advantage that has proven sufficiently durable to incentivize sustained conversion activity among both fleet operators and individual consumers. The ongoing expansion of CNG station infrastructure into tier-2 and tier-3 cities, catalyzed by PNGRB-mandated minimum work programme station installation targets, is progressively unlocking vehicular adoption in markets that previously lacked viable refueling access, creating a self-reinforcing demand cycle that is structurally broadening the addressable CNG consumer base beyond historically saturated metropolitan corridors.
The industrial and commercial PNG segment is rapidly emerging as the next major structural growth pillar of India’s CGD market, as the country’s expanding manufacturing base generates incremental and durable demand for cost-competitive, lower-emission piped natural gas as a direct substitute for furnace oil, high-speed diesel, coal, and liquefied petroleum gas across process heating, steam generation, and kiln applications. Manufacturing clusters in ceramics processing in Morbi, textile dyeing and processing in Surat and Tiruppur, food and beverage production in western India, and pharmaceutical formulations across the Mumbai-Pune-Ahmedabad corridor represent high-density industrial demand nodes that CGD entities have prioritized as anchor customer acquisition targets, given that each industrial connection typically delivers gas volumes equivalent to several hundred residential connections. State pollution control boards operating under the National Clean Air Programme are issuing progressively stringent emission compliance directives to industries located within designated non-attainment cities, creating regulatory urgency that is compelling fuel switching to piped natural gas. Simultaneously, the commercial PNG segment comprising hotels, restaurants, hospitals, and educational institutions is recording double-digit annual growth in new connection additions, driven by urban service sector expansion and the economic attractiveness of PNG relative to commercial LPG cylinder pricing.
India’s leading CGD operators are accelerating capital deployment toward smart metering infrastructure, supervisory control and data acquisition (SCADA) platforms, and geographic information system (GIS)-enabled network management technologies to enhance distribution efficiency, reduce commercial losses, and strengthen safety monitoring across expanding pipeline networks. Advanced metering infrastructure rollout is gaining regulatory momentum following PNGRB directives mandating smart meter installation across new residential and commercial connections, enabling real-time consumption monitoring, remote disconnection capabilities, dynamic tariff management, and automated leak detection. A distinctly India-specific technological frontier is emerging through the integration of compressed biogas (CBG), produced from agricultural crop residue and municipal solid waste, into existing CGD pipeline networks as a pathway to progressively decarbonize the gas supply mix. Several leading CGD entities have entered into long-term CBG procurement agreements with producers operating under the government’s Sustainable Alternative Towards Affordable Transportation scheme, establishing a circular economy linkage between India’s rural waste management infrastructure and its urban gas distribution networks that is without direct parallel in other major gas distribution markets globally.
Key Drivers
Proactive Regulatory Framework and Government-Mandated Geographic Expansion of the CGD Network
India’s CGD sector has been fundamentally shaped by a deliberate and progressively ambitious regulatory architecture administered by the PNGRB, which has systematically orchestrated the authorization of geographical areas through eleven successive competitive bidding rounds, each expanding the licensed network into less commercially mature geographies. Amendments to CGD regulations, encompassing enhanced marketing exclusivity provisions and rationalized network tariff structures for transmission pipelines and city gate stations, have materially improved the investment case for CGD entities bidding in smaller and more geographically dispersed GAs. The government’s overarching objective of raising natural gas’s share in the national primary energy mix to 15% by 2030 has been operationalized through concrete policy mandates, including the prioritization of domestically produced gas at administered prices for CGD entities supplying household PNG and CNG consumers, which confers a significant input cost advantage and supports volume-based earnings predictability. Complementary public funding mechanisms embedded within India’s Smart Cities Mission and urban pipeline development programs supported by the Ministry of Petroleum and Natural Gas have further de-risked CGD capital expenditure in cities undertaking large-scale infrastructure modernization, directly accelerating pipeline laying timelines and consumer connection acquisition rates in priority urban geographies.
Sustained Price Arbitrage Between CNG and Conventional Petroleum Fuels Driving Structural Vehicle Conversion
The persistent and substantial price differential between compressed natural gas and conventional petroleum fuels constitutes the most commercially decisive demand driver within the CNG segment of India’s CGD market. On a per-kilometer operating cost basis, CNG continues to deliver savings of approximately 45% to 60% relative to petrol for equivalent distances, a differential that has proven sufficiently durable to incentivize both fleet operators and individual consumers to absorb the upfront investment associated with CNG conversion kits or factory-fitted CNG vehicle variants. The organized commercial transport segment, comprising app-based taxi aggregator fleets, intercity bus operators, last-mile logistics providers, and autorickshaw operators, has demonstrated particularly high sensitivity to this cost advantage, with fleet acquisition decisions increasingly standardized around CNG powertrains across major metropolitan and tier-2 markets. Original equipment manufacturers have responded to sustained consumer demand by progressively expanding their factory-fitted CNG portfolios across passenger vehicles, light commercial vehicles, and three-wheelers, lending OEM warranty coverage and improved performance credibility to gas-powered variants. State transport corporations in Maharashtra, Gujarat, Haryana, Rajasthan, and Uttar Pradesh have formalized CNG procurement as the default standard for new bus fleet acquisitions, providing CGD entities with large-volume, long-duration anchor customers that underpin CNG station network economics and justify accelerated infrastructure capital investment.
Industrial Energy Transition and Regulatory-Driven Substitution of High-Carbon Liquid and Solid Fuels
India’s expanding industrial base, supported by national production-linked incentive programs designed to scale domestic manufacturing capacity across strategic sectors, is generating a secular demand shift toward piped natural gas as the preferred fuel for process heating, steam generation, and kiln operations. The competitive economics of natural gas relative to furnace oil, high-speed diesel, and coal have become increasingly compelling as global commodity price volatility has exposed the cost risks associated with dependence on imported liquid fuels, while the fixed pipeline tariff structure of CGD networks provides industrial consumers with greater cost predictability. Emission compliance requirements issued by state pollution control authorities under India’s National Clean Air Programme mandate are compelling industries located within designated non-attainment cities to transition from solid and liquid fuels to cleaner piped natural gas alternatives, with non-compliance risks including plant shutdowns and financial penalties serving as powerful behavioral catalysts. Industrial demand clusters in ceramics processing in Morbi, pharmaceutical manufacturing in Gujarat, textile processing in Tamil Nadu, and engineering industries across the Delhi-NCR and Pune manufacturing belts represent high-priority customer acquisition targets for CGD entities, as each secured industrial PNG connection delivers volumes equivalent to hundreds of residential connections, fundamentally improving the unit economics and capital efficiency of pipeline network investments in those geographies.
Key Challenges
Structural Dependence on Imported RLNG and Exposure to Global Gas Price Volatility Compressing CGD Margins
India’s domestic natural gas production has historically been insufficient to meet the rapidly expanding requirements of the CGD sector, compelling authorized entities to supplement government-allocated domestic gas volumes with regasified liquefied natural gas sourced from international markets. RLNG pricing is inherently linked to global LNG benchmarks, including the Japan Korea Marker and Henry Hub-indexed term contracts, exposing CGD entities to significant and often abrupt gas input cost fluctuations that cannot always be fully passed through to price-sensitive retail consumers without triggering demand destruction, particularly in household PNG and CNG segments where consumers retain the option of reverting to LPG or petroleum substitutes. The government’s domestic gas allocation policy, while extending administered-price volumes on a priority basis to household PNG and CNG consumers, does not cover the full quantum of CGD sector demand, leaving a meaningful share of procurement dependent on market-linked RLNG pricing. This dual-source procurement structure creates complex margin management challenges, particularly during periods of global LNG price escalation, when the differential between subsidized domestic gas and market-priced RLNG widens substantially. Furthermore, India’s regasification terminal infrastructure remains geographically concentrated along the western coastline, creating logistical and tariff-driven cost disadvantages for CGD entities serving landlocked and eastern Indian geographies where access to competitively priced RLNG is constrained by the accumulation of transmission pipeline tariffs over greater distances.
Right-of-Way Acquisition Bottlenecks and Physical Infrastructure Delays Impeding Last-Mile Pipeline Expansion
The physical development of CGD networks across newly authorized geographical areas is frequently impeded by significant delays in securing statutory right-of-way permissions from municipal corporations, state highway authorities, national highway agencies, railway crossing departments, and forest and irrigation bodies, each operating under independent approval frameworks without the benefit of a unified single-window clearance mechanism for gas pipeline infrastructure. The pipeline laying process in densely urbanized areas requires coordinated approvals across multiple government bodies at different administrative tiers, resulting in prolonged project timelines that defer connection acquisition and delay the commercial revenue ramp-up necessary to support capital recovery on network investments. Road restoration disputes between CGD entities and urban local bodies following pipeline trench reinstatement have emerged as a recurring operational friction, with municipal restoration cost assessments frequently exceeding actual reinstatement expenditures and creating financial and legal ambiguity. In rapidly urbanizing peri-urban and satellite town geographies, incomplete master urban planning frameworks generate ambiguity regarding permissible pipeline corridors and setback distances from future infrastructure projects, necessitating expensive pipeline relocation in subsequent years. Additionally, a structural shortage of trained pipeline construction contractors, certified welders, and corrosion protection specialists in tier-2 and tier-3 cities imposes a practical constraint on the pace of minimum work programme capital execution, creating regulatory compliance risk and competitive vulnerability for CGD entities approaching the end of their marketing exclusivity period.
Economically Unviable Geographical Areas and the Financial Burden of Cross-Subsidizing Nascent Distribution Networks
The aggressive geographic expansion strategy orchestrated through successive PNGRB bidding rounds has resulted in the authorization of numerous geographical areas that encompass predominantly rural, agrarian, or low-density semi-urban territories with inherently limited near-term gas consumption potential. CGD entities that submitted competitive bids incorporating high network development commitments in these commercially challenged GAs are now confronted with the economic reality of deploying substantial capital in pipeline infrastructure and CNG stations serving dispersed, price-sensitive consumer populations where per-connection unit economics are materially inferior to those prevailing in established metropolitan markets. The structural cross-subsidization of underperforming GAs from the operating cash flows of commercially mature anchor GAs within the same corporate portfolio imposes a growing financial burden on multi-GA operators, constraining dividend capacity and investment flexibility. Consumer affordability constraints in lower-income household segments, combined with the deeply embedded cultural preference for subsidized LPG cylinders supported by extensive last-mile retail distribution infrastructure, create demand inelasticity that makes PNG conversion economically rational only when connection fees and pipeline extension costs remain negligible. Managing the financial sustainability of thin-volume GAs while sustaining capital investment momentum required to comply with PNGRB minimum work programme obligations, and simultaneously avoiding regulatory sanctions, constitutes one of the most complex and consequential strategic challenges confronting portfolio CGD operators in India’s current market environment.
Market Segmentation
- Segmentation By Consumer Type
- Residential (Household PNG)
- Commercial (Hotels, Restaurants, and Institutions)
- Industrial (PNG for Manufacturing and Process Heating)
- Transportation (CNG for Vehicular Use)
- Others
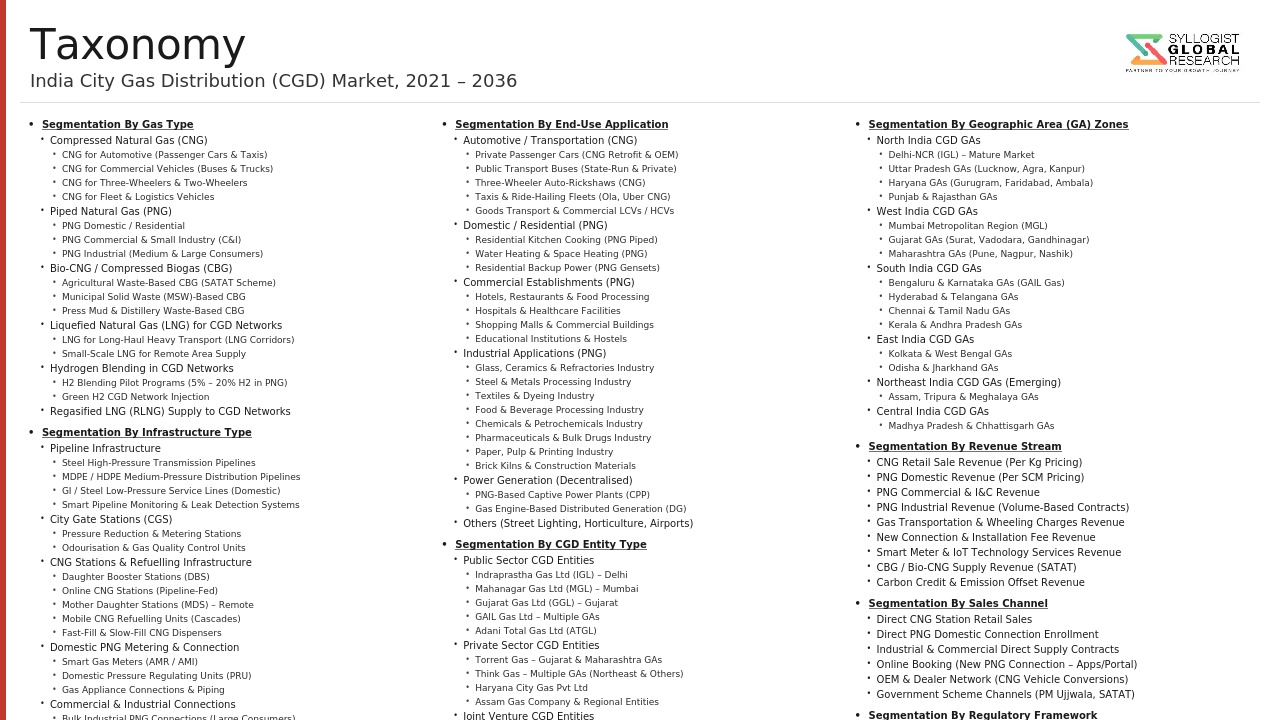
- Segmentation By Gas Type
- Piped Natural Gas (PNG)
- Compressed Natural Gas (CNG)
- Regasified Liquefied Natural Gas (RLNG)
- Compressed Biogas (CBG) / Bio-CNG
- Segmentation By Infrastructure Type
- CNG Dispensing Stations (Company-Operated)
- CNG Dispensing Stations (Dealer-Operated)
- City Gate Stations and Pressure Reduction Stations
- Steel and HDPE Distribution Pipelines
- Metering and Regulation Stations
- Others
- Segmentation By End-Use Application
- Cooking and Water Heating (Residential)
- Vehicular Fuel (CNG for Passenger, Commercial, and Three-Wheeler Vehicles)
- Process Heating and Steam Generation (Industrial)
- Food Service and Catering (Commercial)
- Captive Power Generation
- Others
- Segmentation By Geography
- North India (Delhi-NCR, Punjab, Haryana, Uttar Pradesh, and Rajasthan)
- West India (Gujarat, Maharashtra, Madhya Pradesh, and Goa)
- South India (Tamil Nadu, Karnataka, Andhra Pradesh, Telangana, and Kerala)
- East India (West Bengal, Odisha, Bihar, and Jharkhand)
- North-East India and Other Union Territories
- Segmentation By Operator Type
- Public Sector Undertaking (PSU)-Promoted CGD Entities
- Private Sector CGD Entities
- Joint Venture CGD Entities (PSU-Private Partnerships)
- Others
- Segmentation By Pipeline Material
- Steel Pipelines (High-Pressure Transmission Networks)
- High-Density Polyethylene (HDPE) Pipelines (Medium and Low-Pressure Distribution)
- Others
- Segmentation By Metering Technology
- Conventional Diaphragm and Rotary Gas Meters
- Smart Prepaid Gas Meters
- Advanced Metering Infrastructure (AMI) and IoT-Enabled Smart Gas Meters
- Others
All market revenues are presented in USD
Historical Year: 2021–2024 | Base Year: 2025 | Estimated Year: 2026 | Forecast Period: 2027–2036
Key Questions this Study Will Answer
- What is the projected market valuation and volume trajectory of India’s CGD sector through 2036, disaggregated by consumer type, gas type, and geographic region, and what quantitative assumptions underpin the forecast for household PNG connection additions, CNG station proliferation, and industrial PNG volume growth across the forecast period?
- How will the progressive geographic expansion of authorized CGD geographical areas under successive PNGRB bidding rounds reshape competitive dynamics among leading CGD operators, and which newly licensed GAs offer the highest incremental volume growth potential based on population density, vehicle penetration rates, and industrial concentration metrics?
- To what extent will global LNG price volatility, domestic gas allocation policy revisions, and the pricing differential between administered and market-linked gas sources affect the margin profiles, retail pricing strategies, and volume growth targets of India’s CGD entities across the forecast horizon?
- What is the projected contribution of compressed biogas blending, smart metering infrastructure deployment, and SCADA-enabled network digitization to the operational efficiency, regulatory compliance posture, and long-term sustainability commitments of leading CGD operators in India through 2036?
- Who are the leading CGD entities currently defining the competitive landscape of India’s city gas distribution market, what is their respective geographical area portfolio composition, and what strategic priorities are they pursuing across capital deployment, consumer acquisition, technology adoption, and gas procurement diversification to sustain competitive advantage through the forecast period?
- Product Definition
- Research Methodology
- Research Design & Framework
- Overall Research Approach: Descriptive, Exploratory & Quantitative Mixed-Method Design
- Market Definition & Scope Boundaries: What is Included and Excluded
- Segmentation Framework
- Key Research Assumptions & Limitations
- Secondary Research
- Primary Research Design & Execution
- Data Triangulation & Validation
- Market Sizing & Forecasting Methodology
- Competitive Intelligence Methodology
- Quality Assurance & Peer Review
- Definitions, Abbreviations & Data Notes
- Research Design & Framework
- Executive Summary
- Market Snapshot & Headline Numbers
- Key Findings & Research Highlights
- Market Dynamics
- Zone-Wise & State-Wise Market Summary
- Competitive Landscape Snapshot
- Technology & Innovation Highlights
- Market Dynamics
- Drivers
- Restraints
- Opportunities
- Challenges
- Porter’s Five Forces Analysis
- PESTLE Analysis
- Market Trends & Developments
- Emerging Trends
- Technological Developments
- Regulatory & Policy Changes
- Supply Chain & Sourcing Trends
- Infrastructure & Capacity Expansion Trends
- Investment & Funding Activity
- Sustainability & ESG Trends
- Risk Assessment Framework
- Geopolitical & Political Risk
- Raw Material & Infrastructure Supply Chain Risk
- Environmental & Regulatory Compliance Risk
- Financial / Market Risk
- Technology Maturity & Adoption Risk
- Competition & Substitution Risk
- Regulatory Framework & Standards
- PNGRB (Petroleum & Natural Gas Regulatory Board) Framework
- BIS (Bureau of Indian Standards) Standards for CGD Components
- MoPNG & OISD (Oil Industry Safety Directorate) Regulations
- Environmental Regulations Applicable to CGD Sector
- State-Level Regulatory Bodies & Their Role in CGD Development
- India City Gas Distribution (CGD) Market Outlook
- Market Size & Forecast by Value
- Market Size & Forecast by Volume (MMSCMD / BCM)
- Market Size & Forecast by Gas Type
- CNG (Compressed Natural Gas)
- CNG for Automotive (4-Wheelers, 3-Wheelers, Buses)
- CNG for Commercial Vehicles (Trucks, Fleets)
- CNG for Industrial Use
- PNG (Piped Natural Gas)
- PNG Domestic (Residential)
- PNG Commercial (Hotels, Hospitals, Offices, Restaurants)
- PNG Industrial
- CBG (Compressed Bio-Gas)
- CNG (Compressed Natural Gas)
- Market Size & Forecast by End-Use Segment
- Residential (Domestic PNG)
- Households Connected Under PNG
- Average Daily Consumption per Household
- Pending Connection Pipeline
- Commercial
- Hotels & Hospitality
- Hospitals & Healthcare
- Offices, Malls & Retail
- Restaurants & Food Services
- Educational Institutions
- Industrial
- Ceramic & Glass Industry
- Textile Industry
- Food Processing Industry
- Chemical & Petrochemical Industry
- Steel, Metal & Forging Industry
- Pharmaceutical Industry
- Paper & Pulp Industry
- Others
- Transportation (CNG Automotive)
- 3-Wheelers (Auto-Rickshaws)
- 4-Wheelers (Cars, Taxis, Cabs)
- Buses (City & Inter-City)
- Trucks & Commercial Vehicles
- Others
- Market Size & Forecast by Infrastructure Type
- Pipeline Network
- Steel Pipeline (Trunk / Distribution Lines)
- HDPE Pipeline (Service Lines & Last Mile)
- CNG Stations
- Mother Stations
- Online Stations
- Daughter Stations (DBS)
- Mobile CNG Dispensing Units
- PNG Connections
- Domestic PNG Connections
- Commercial PNG Connections
- Industrial PNG Connections
- LNG / RLNG Receiving Terminals & City Gate Stations
- Pipeline Network
- Market Size & Forecast by Source of Gas
- Domestic Produced Natural Gas (APM Gas)
- Imported LNG / RLNG
- R-LNG (Regasified LNG) from Terminals
- CBG (Compressed Bio-Gas)
- Green Hydrogen Blended Gas
- Market Size & Forecast by Network Development Stage
- Operational Networks (Fully Commissioned GAs)
- Under-Development Networks (Partially Commissioned GAs)
- Newly Authorized GAs (Yet to be Developed)
- Market Size & Forecast by Bidding Round
- Rounds 1–6 (Legacy Authorized GAs)
- Rounds 7–9 (IGL, MGL, Adani, Gujarat Gas Era)
- Rounds 10–11 Authorized GAs
- Round 12 Authorized GAs
- Market Size & Forecast by Ownership Type
- PSU-Led CGD Entities
- Indraprastha Gas Ltd (IGL)
- Mahanagar Gas Ltd (MGL)
- Gujarat Gas Ltd (GGL)
- Bharat Gas Resources Ltd (BGRL)
- HPCL-Rajasthan Vikas Ltd (HRRL)
- Others
- Private-Led CGD Entities
- Adani Gas Ltd (ATGL)
- Torrent Gas Pvt Ltd
- Sabarmati Gas Ltd (SGL)
- AG & P Pratham Pvt Ltd
- Charotar Gas Sahakari Mandali Ltd (CGSML)
- Others
- Joint Venture / Consortium CGD Entities
- PSU-Led CGD Entities
- Residential (Domestic PNG)
- India CGD Market Outlook – Zone-Wise
- Market Size & Forecast
- By Value
- By Volume (MMSCMD)
- By Gas Type
- By End-Use Segment
- By Infrastructure Type
- North Zone Market Outlook
- Key States: Delhi, UP, Haryana, Punjab, Rajasthan, Himachal Pradesh, J&K, Uttarakhand
- Geographical Areas (GAs) Authorized & Operational
- Key CGD Entities Operating
- CNG Network Status & Growth Trajectory
- PNG Residential & Industrial Connection Status
- Demand Drivers & Constraints
- West Zone Market Outlook
- Key States: Gujarat, Maharashtra, Goa, Madhya Pradesh
- Geographical Areas (GAs) Authorized & Operational
- Key CGD Entities Operating
- CNG Network Status & Growth Trajectory
- PNG Residential & Industrial Connection Status
- Demand Drivers & Constraints
- South Zone Market Outlook
- Key States: Telangana, Andhra Pradesh, Karnataka, Tamil Nadu, Kerala
- Geographical Areas (GAs) Authorized & Operational
- Key CGD Entities Operating
- CNG Network Status & Growth Trajectory
- PNG Residential & Industrial Connection Status
- Demand Drivers & Constraints
- East Zone Market Outlook
- Key States: West Bengal, Odisha, Jharkhand, Bihar, Chhattisgarh, Assam, NE States
- Geographical Areas (GAs) Authorized & Operational
- Key CGD Entities Operating
- CNG Network Status & Growth Trajectory
- PNG Residential & Industrial Connection Status
- Demand Drivers & Constraints
- Central Zone Market Outlook
- Key States: Madhya Pradesh, Chhattisgarh, Uttarakhand, UP (Central)
- Geographical Areas (GAs) Authorized & Operational
- Key CGD Entities Operating
- CNG Network Status & Growth Trajectory
- PNG Residential & Industrial Connection Status
- Demand Drivers & Constraints
- Market Size & Forecast
- India CGD Market Outlook – State-Wise
- Market Size & Forecast by State
- By Value
- By Volume (MMSCMD)
- By Gas Type
- By End-Use Segment
- Gujarat
- Total GAs Authorized & Operational
- CNG Stations & Vehicles Converted
- PNG Household, Commercial & Industrial Connections
- Key Players: Gujarat Gas, Sabarmati Gas, CGSML, Others
- Gas Sourcing: ONGC, GSPC, RLNG
- Growth Outlook & Key Projects
- Maharashtra
- Total GAs Authorized & Operational
- CNG Stations & Vehicles Converted
- PNG Household, Commercial & Industrial Connections
- Key Players: MGL, Adani Gas, Torrent Gas, Others
- Gas Sourcing & LNG Terminals (Hazira, Dabhol)
- Growth Outlook & Key Projects
- Delhi (NCT) & NCR (Haryana, UP)
- Total GAs Authorized & Operational
- CNG Stations & Vehicles Converted
- PNG Household, Commercial & Industrial Connections
- Key Players: IGL, Haryana City Gas (HCGDL), Others
- Gas Sourcing & GAIL Pipeline Access
- Growth Outlook & Key Projects
- Uttar Pradesh
- Total GAs Authorized & Operational
- CNG Stations & Vehicles Converted
- PNG Household, Commercial & Industrial Connections
- Key Players: IGL, Adani Gas, GSPL India Gasnet, AG & P Pratham, Others
- Gas Sourcing & GAIL Network Connectivity
- Growth Outlook & Key Projects
- Rajasthan
- Madhya Pradesh
- Andhra Pradesh & Telangana
- Karnataka
- Tamil Nadu
- Haryana
- Punjab
- Odisha
- West Bengal
- Bihar & Jharkhand
- Chhattisgarh
- Himachal Pradesh & Uttarakhand
- Kerala
- North-East States (Assam, Tripura & Others)
- Other States & Union Territories
- Market Size & Forecast by State
- India CGD Market Outlook – City / Geographical Area (GA)-Wise
- Market Size & Forecast by GA Category
- Metro & Tier-1 Cities (High-Density GAs)
- Tier-2 Cities (Mid-Density GAs)
- Tier-3 Cities & District Level GAs
- Semi-Urban & Rural GAs
- Top Performing GAs – Detailed Analysis
- Delhi (IGL)
- Mumbai (MGL)
- Ahmedabad (Gujarat Gas)
- Surat (Gujarat Gas)
- Vadodara (Gujarat Gas)
- Pune (Maharashtra Natural Gas Ltd / MNGL)
- Hyderabad / Secunderabad (Bhagyanagar Gas Ltd / BGL)
- Bengaluru (IGL / Adani Gas)
- Agra & Lucknow (IGL)
- Indore, Bhopal, Gwalior (Central India Gas / Adani Gas)
- Kota, Jaipur (Adani Gas)
- Chandigarh / Tricity (GLNG / Adani Gas)
- Others
- Newly Commissioned GAs – Growth Potential
- Round 12 GAs – Investment Pipeline & Timeline
- Market Size & Forecast by GA Category
- Technology Landscape & Innovation Analysis
- CGD Network Technology Overview
- CNG Compression & Dispensing Technology
- Conventional CNG Mother & Daughter Station Technology
- Mobile CNG Dispensing (MCNG) Units
- Fast-Fill vs. Slow-Fill CNG Dispensers
- PNG Distribution Technology
- HDPE Pipe Technology for Service Lines
- Steel Pipeline Technology for High-Pressure Distribution
- Smart Gas Meters & Advanced Metering Infrastructure (AMI)
- Pressure Reduction Stations & City Gate Stations
- Digital Technology in CGD Operations
- SCADA (Supervisory Control & Data Acquisition) for Network Monitoring
- AI/ML-Based Predictive Maintenance & Leak Detection
- GIS-Based Network Mapping & Asset Management
- Customer App & Digital Billing Platforms
- Green Technology & Innovation
- CBG (Compressed Bio-Gas) Integration in CGD Systems
- Green Hydrogen Blending in Natural Gas Pipelines
- Solar-Powered CNG Station Innovations
- R&D and Innovation Ecosystem
- IIT/NIT Academic Research on Gas Distribution Efficiency
- Startup Ecosystem in Gas Tech (Metering, Analytics, Safety)
- Industry-Government R&D Collaborations (PNGRB, IIP, GAIL, BPCL)
- Value Chain & Supply Chain Analysis
- Upstream Gas Supply
- Domestic Production (ONGC, OIL, Private E&P Companies)
- LNG Imports (Qatar Gas, ExxonMobil, Shell, TotalEnergies)
- CBG / Biomethane Supply Chain
- Midstream – Gas Transportation & Transmission
- GAIL’s National Gas Grid (NATGAS)
- GSPL, HPCL-Mittal Pipeline Network
- State Gas Grid Connectivity
- LNG Regasification Terminals
- Dahej Terminal (PLL)
- Hazira Terminal (Shell / PLL)
- Kochi Terminal (PLL)
- Dabhol Terminal (RGPPL)
- Mundra, Ennore, Jaigarh Terminals
- Downstream – CGD Network
- City Gate Stations (CGS)
- CNG Stations Network
- PNG Distribution Pipeline Network
- Industrial PNG Connections
- Equipment & Component Supply Chain
- HDPE & Steel Pipe Manufacturers
- Gas Compressor Manufacturers
- Gas Meter & Pressure Regulator Manufacturers
- CNG Dispenser & Equipment OEMs
- End Consumers
- Residential PNG Consumers
- Commercial PNG Consumers
- Industrial PNG Consumers
- CNG Vehicle Users
- Upstream Gas Supply
- Pricing Analysis
- Natural Gas Pricing Mechanism in India
- CNG Retail Pricing Analysis
- PNG Pricing Analysis
- Price Regulation by PNGRB
- Impact of International Gas Price Volatility on India CGD Sector
- Sustainability & Energy Efficiency
- Environmental Benefits of CGD vs. Liquid Fossil Fuels
- CBG (Compressed Bio-Gas) & SATAT Scheme
- Green Hydrogen Blending in CGD Networks
- ESG Reporting & Sustainability Commitments of CGD Entities
- Energy Efficiency in CGD Operations
- Competitive Landscape
- Market Structure & Concentration
- Market Consolidation Level (Fragmented vs. Consolidated)
- Top 5 Players Market Share
- HHI (Herfindahl-Hirschman Index) Concentration Analysis
- Competitive Intensity Map
- Player Classification
- Market Leaders
- Strong Challengers
- Specialist / Niche Players
- Emerging & Round-12 New Entrant Players
- Regional / State-Level Players
- Competitive Analysis Frameworks
- Market Share Analysis
- Company Profile
- Company Overview & HQ
- Products & Services Portfolio (CNG, PNG – Domestic, Commercial, Industrial)
- GAs Authorized, Operational & Under Development
- CNG Stations & PNG Connections (as on latest period)
- Overall Revenue & Segmental Revenue
- Gas Sourcing Agreements
- Recent Developments (Investments, Expansions, Partnerships, Acquisitions)
- SWOT Analysis
- Strategic Focus Areas
- Competitive Positioning Map
- Key Company Profiles
- Market Structure & Concentration
- Strategic Output
- Market Opportunity Matrix – By GA / State / Segment
- White Space Opportunity Analysis
- Underserved Geographies with High GA Potential
- Underserved Segments: Industrial PNG, CBG Integration
- Technology Gaps in Smart Metering & Digital CGD Operations
- Strategic Recommendations
- CNG Network Expansion & Station Densification Strategy
- PNG Domestic Connection Rollout Acceleration Strategy
- Industrial PNG Segment Penetration Strategy
- CBG Integration & SATAT Implementation Roadmap
- Green Hydrogen Blending Readiness Strategy for CGD Entities
- Digital Transformation & Smart Metering Deployment Strategy
- Pricing & Commercial Strategy for Competitive Positioning
- Regulatory Compliance & PNGRB Engagement Strategy
- Supply Chain Resilience & Gas Sourcing Diversification Strategy
- Geographic Expansion Strategy (Round-12 & Beyond GAs)
- Partnership, M&A & Joint Venture Strategy in CGD Sector
- Risk Mitigation & Future Roadmap
- Strategic Priority Matrix & Roadmap
- Near-term (2025–2027)
- Mid-term (2028–2030)
- Long-term (2031–2034)