Market Definition
The Global PFAS Water Treatment Technologies Market encompasses the research, development, engineering, manufacturing, deployment, and operational service of specialized water and wastewater treatment systems designed to detect, concentrate, remove, and destroy per- and polyfluoroalkyl substances from drinking water sources, groundwater, surface water, industrial process water, leachate streams, and aqueous film-forming foam-impacted site water. Per- and polyfluoroalkyl substances are a class of more than 12,000 synthetic organofluorine chemical compounds characterized by highly stable carbon-fluorine bonds that confer extreme chemical, thermal, and biological persistence in environmental matrices, earning their designation as forever chemicals, and are associated with a wide spectrum of adverse human health effects including thyroid disruption, immune system suppression, developmental toxicity, elevated cholesterol, kidney cancer, and testicular cancer at exposure concentrations measurable in parts per trillion. PFAS contamination originates from industrial manufacturing of fluoropolymers and fluorosurfactants, use of aqueous film-forming foam at military bases and civilian airports, application of PFAS-containing food packaging and consumer product coatings, land disposal of biosolids from wastewater treatment plants, and industrial discharges from electroplating, semiconductor fabrication, textile treatment, and chrome plating facilities that have collectively resulted in widespread PFAS detection in drinking water supplies, groundwater aquifers, surface water bodies, and soils across North America, Europe, Australia, and increasingly across Asia and Latin America. The market encompasses the complete treatment technology portfolio including granular activated carbon adsorption, high-pressure membrane filtration through nanofiltration and reverse osmosis, ion exchange resins specifically engineered for PFAS selectivity, advanced oxidation and reduction processes including electrochemical oxidation, ultraviolet-activated persulfate, sonochemical destruction, supercritical water oxidation, and thermal treatment technologies including smoldering combustion and high-temperature incineration of PFAS-loaded residuals. Key participants include treatment technology developers, engineering firms, water utilities, industrial site remediators, military installation operators, and regulatory agencies establishing maximum contaminant levels.
Market Insights
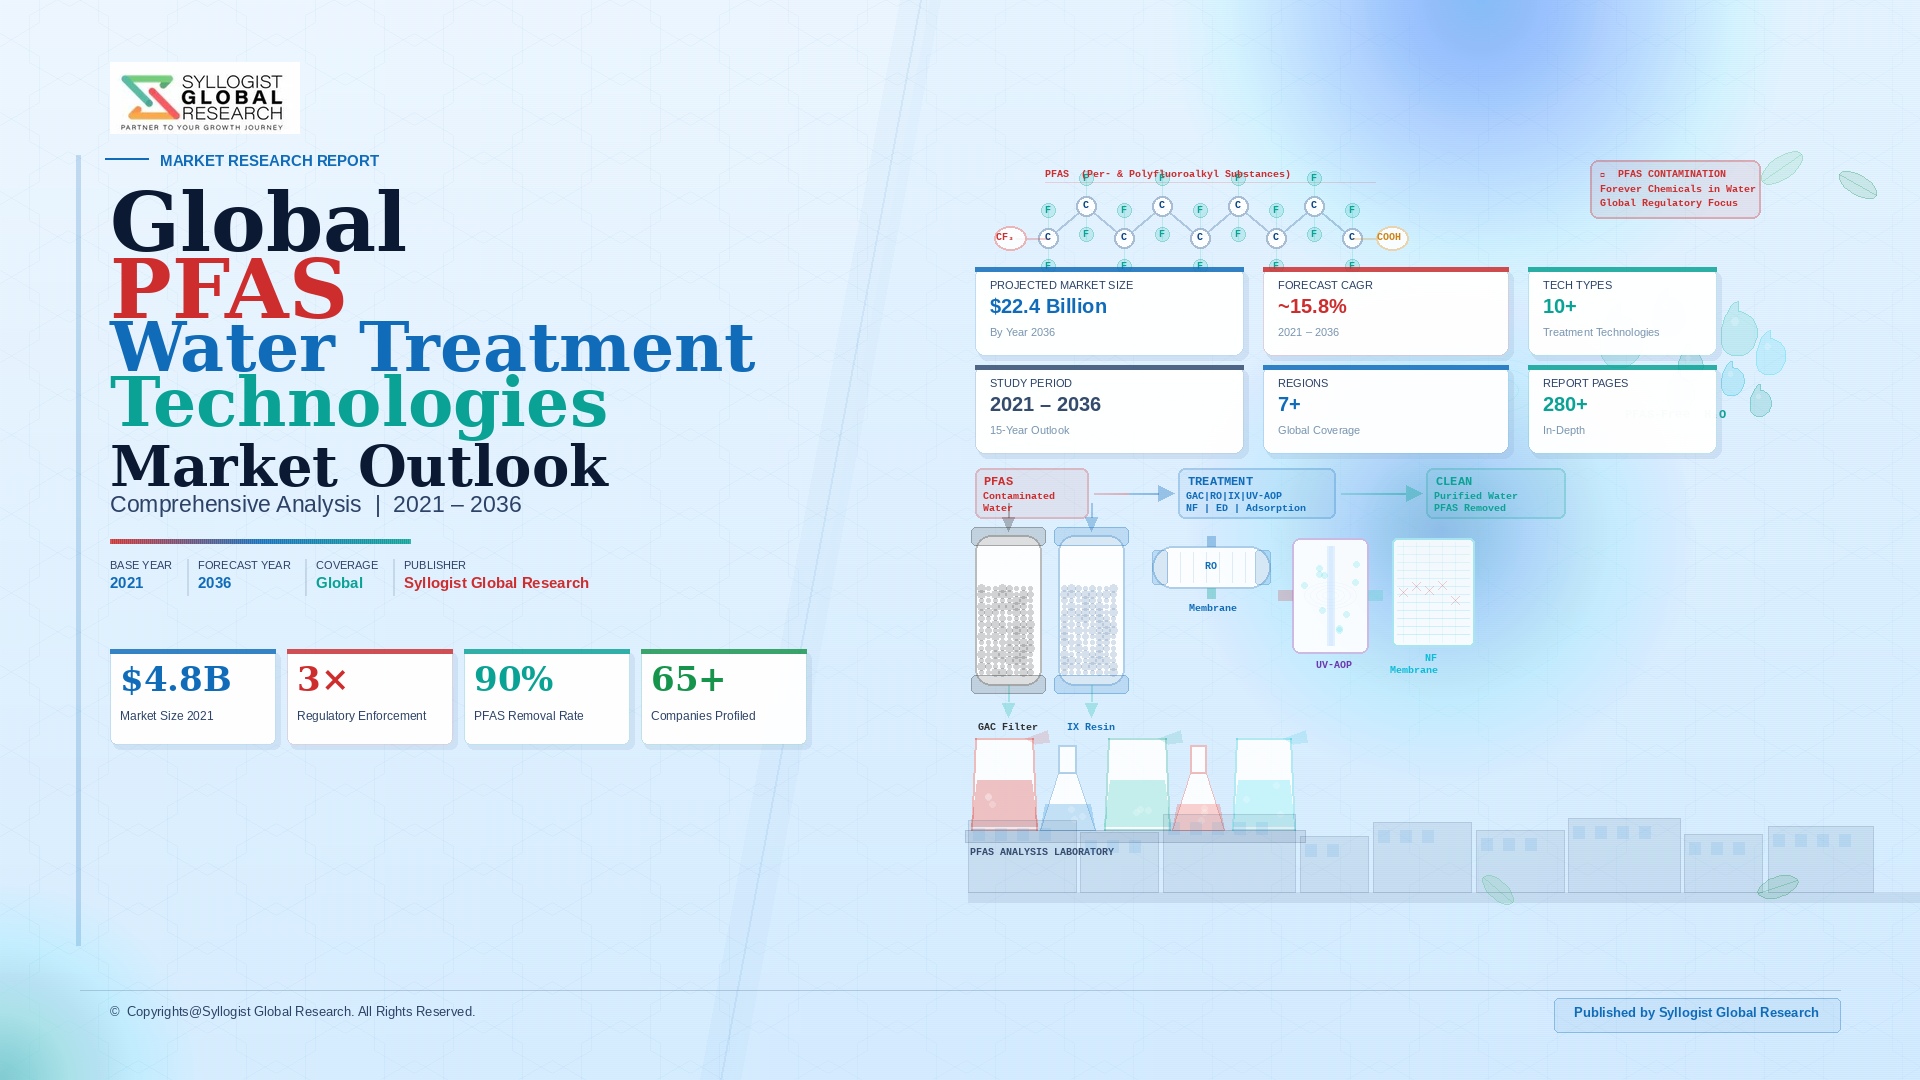
The global PFAS water treatment technologies market was valued at approximately USD 2.8 billion in 2025 and is projected to reach USD 11.4 billion by 2034, advancing at a compound annual growth rate of 16.8% over the forecast period from 2027 to 2034, driven by the sweeping regulatory tightening of PFAS maximum contaminant levels in drinking water across the United States, European Union, United Kingdom, and Australia that is converting PFAS contamination from a voluntary remediation concern into a legally mandated compliance obligation requiring immediate and substantial capital investment in treatment infrastructure by drinking water utilities, industrial dischargers, and contaminated site operators. The United States Environmental Protection Agency’s April 2024 finalization of the first-ever federal maximum contaminant levels for PFAS in drinking water, setting enforceable limits of 4 parts per trillion for perfluorooctanoic acid and perfluorooctane sulfonic acid individually and 10 parts per trillion for a hazard index of four additional PFAS compounds, represents the single most commercially consequential regulatory action in the history of the PFAS treatment market, applying to approximately 66,000 public water systems serving approximately 100 million people in the United States and requiring systems exceeding the maximum contaminant levels to install treatment within five years of the rule’s effective date, generating an estimated treatment capital investment requirement of approximately USD 1.5 billion to USD 2.0 billion annually across the United States water utility sector alone over the compliance implementation period. The European Union’s recast Drinking Water Directive, which established a total PFAS sum parameter limit of 100 nanograms per liter for drinking water effective from January 2026, combined with national PFAS regulatory programs in Germany, the Netherlands, Sweden, Denmark, and the United Kingdom that have set individual PFAS limits in the range of 10 to 100 nanograms per liter across drinking water and groundwater regulatory frameworks, is generating a parallel European treatment compliance investment wave whose capital requirements are estimated at approximately USD 800 million to USD 1.2 billion annually through the late 2020s.
Granular activated carbon adsorption represents the most commercially deployed and operationally established PFAS treatment technology within the global market, accounting for approximately 41% of total PFAS treatment system revenue in 2025, adopted extensively by drinking water utilities as an immediately deployable retrofit technology compatible with existing treatment plant infrastructure that achieves reliable PFAS removal to below maximum contaminant level thresholds for the longer-chain PFAS compounds including perfluorooctanoic acid and perfluorooctane sulfonic acid that are the primary regulatory focus of current drinking water standards. However, granular activated carbon exhibits significantly reduced adsorption efficiency for short-chain PFAS compounds including perfluorobutanoic acid, perfluoropentanoic acid, and perfluorobutane sulfonic acid whose lower hydrophobicity reduces affinity for activated carbon surfaces, and requires periodic carbon regeneration or replacement that generates a PFAS-concentrated spent carbon waste stream requiring high-temperature destruction rather than conventional landfill disposal, creating an ongoing operational cost and residuals management challenge for utilities and industrial operators relying on granular activated carbon as their primary PFAS control technology. Ion exchange resin technology, utilizing single-use or regenerable anion exchange resins with engineered selectivity for PFAS compounds including both long and short-chain variants, is the fastest-growing PFAS treatment technology segment at approximately 24.3% annual growth in 2025, driven by its superior performance for short-chain PFAS removal relative to granular activated carbon, its lower bed volume requirement and smaller footprint, and the development of regenerable resin systems from technology providers including Purolite, Lanxess, and ResinTech that reduce operational cost by enabling multiple treatment cycles before resin disposal and offering the potential for PFAS concentration and recovery from regeneration brines for subsequent destruction processing.
The PFAS destruction technology segment, which addresses the ultimate fate of PFAS compounds removed from water and concentrated into spent adsorbent residuals, ion exchange regeneration brines, and reverse osmosis concentrate streams, represents the most technologically dynamic and commercially nascent component of the PFAS treatment value chain, with a range of emerging destruction technologies competing to establish commercial viability at the scale and cost required to eliminate the PFAS contained in treatment residuals rather than transferring the contamination to solid waste disposal streams that risk future environmental recontamination. Electrochemical oxidation systems that apply electrical current through boron-doped diamond electrodes to generate hydroxyl radicals capable of breaking the carbon-fluorine bonds of PFAS compounds in aqueous concentrate solutions are achieving PFAS destruction efficiencies exceeding 99% for perfluorooctanoic acid and perfluorooctane sulfonic acid in laboratory and pilot-scale demonstrations, with companies including Aclarity, Electro-Chemical Technologies, and Axine Water Technologies advancing commercial-scale system designs capable of processing the concentrated regeneration brines from ion exchange systems and reverse osmosis permeate reject streams at treatment costs estimated at USD 8 to USD 18 per gallon of concentrate treated. Supercritical water oxidation, which reacts PFAS compounds with oxygen at temperatures above 374 degrees Celsius and pressures above 221 bar to completely mineralize organic molecules including the carbon-fluorine bond structures of PFAS into carbon dioxide, hydrogen fluoride, and water without incomplete combustion byproducts, is advancing toward commercial deployment through programs supported by the United States Department of Defense, which operates the largest concentration of aqueous film-forming foam-contaminated sites globally across its military installation portfolio and has allocated over USD 2.4 billion in PFAS investigation and remediation investment through the 2025 fiscal year with substantially larger future obligations projected as site characterization programs define the full extent of contamination requiring treatment.
The industrial wastewater and contaminated site remediation segment constitutes the second-largest application category within the global PFAS treatment market, accounting for approximately 34% of total market revenue in 2025, encompassing treatment of process water, wastewater, leachate, and groundwater at facilities including fluoropolymer and fluorosurfactant manufacturing plants, electroplating and chrome plating facilities, semiconductor fabrication plants, textile treatment facilities, food packaging manufacturers, military bases, civilian airports, firefighter training facilities, and landfill sites receiving PFAS-contaminated biosolids whose leachate represents a chronic and concentrated source of PFAS release to underlying groundwater. The scale of PFAS-contaminated site remediation liability across the United States alone, estimated at over 57,000 contaminated sites identified through Department of Defense and Environmental Protection Agency site assessment programs as of 2025, with total remediation cost estimates ranging from USD 400 billion to USD 1 trillion across all identified contaminated sites requiring cleanup to current regulatory standards, represents a treatment demand of extraordinary magnitude that will sustain market growth across multiple decades as remediation programs proceed through the investigation, design, procurement, construction, and long-term operations phases of the remediation lifecycle at each individual site. Liability-driven investment in PFAS treatment is also being mobilized through the landmark USD 10.3 billion settlement agreement reached in 2023 between 3M and public water utilities represented by the Water Works Association, the USD 1.185 billion settlement between DuPont, Corteva, and Chemours with municipal water providers, and ongoing litigation against other PFAS manufacturers and users that is directing private capital into treatment infrastructure procurement and installation through legally mandated settlement funding mechanisms that operate independently of regulatory compliance timelines.
Key Drivers
Legally Enforceable Federal and National PFAS Maximum Contaminant Levels in Drinking Water Creating Mandatory Compliance Investment Obligations for Thousands of Water Systems Globally
The transition from voluntary PFAS remediation guidance to legally enforceable maximum contaminant levels in drinking water across major economies represents the most powerful and commercially decisive driver of the global PFAS treatment technology market, as mandatory compliance obligations imposed by the United States Environmental Protection Agency’s 2024 PFAS National Primary Drinking Water Regulation, the European Union’s recast Drinking Water Directive, and national regulatory programs in the United Kingdom, Australia, and Canada collectively create a multi-billion-dollar compliance capital investment requirement that water utilities must fulfill within defined regulatory timelines regardless of economic cycle, utility financial capacity, or technology cost considerations. The United States PFAS National Primary Drinking Water Regulation, applicable to approximately 66,000 public water systems, requires systems exceeding maximum contaminant levels to install treatment by 2029, with the Environmental Protection Agency estimating that approximately 6,700 to 9,600 public water systems will require treatment installation to achieve compliance, generating a concentrated compliance capital expenditure demand wave of approximately USD 1.5 billion to USD 2.0 billion annually over the five-year compliance implementation period that is underpinning a transformative expansion in PFAS treatment system procurement, engineering services, and technology supply chain capacity across the United States water utility sector. The broad class-based regulatory approach adopted by the European Union’s recast Drinking Water Directive, which targets a sum parameter of all PFAS including thousands of individual compounds rather than only the specific perfluorooctanoic acid and perfluorooctane sulfonic acid targeted by earlier guidance values, is technically more demanding than United States maximum contaminant levels in requiring treatment systems capable of removing the full spectrum of PFAS variants present in source water rather than optimizing performance for the two most regulated compounds, driving investment in more sophisticated treatment configurations including ion exchange and advanced oxidation combinations rather than granular activated carbon alone.
Expanding PFAS Litigation Settlements Directing Multi-Billion-Dollar Private Capital Into Treatment Infrastructure Procurement Outside of Normal Regulatory Compliance Funding Pathways
The wave of successful litigation against PFAS manufacturers and industrial users of aqueous film-forming foam has generated a series of landmark financial settlements that are directing unprecedented quantities of private capital into PFAS treatment infrastructure investment through legally mandated funding mechanisms that operate in parallel to and independently of regulatory compliance timelines, creating an additional and commercially significant market demand stream for PFAS treatment technology that is not dependent on regulatory implementation pace, utility capital budget availability, or government infrastructure funding appropriation processes. The USD 10.3 billion settlement reached by 3M in 2023 with thousands of municipal water utilities, the largest environmental settlement in United States history, provides water system plaintiffs with funding specifically designated for PFAS treatment infrastructure procurement and installation that supplements regulatory compliance funding sources and enables utilities to advance treatment investment timelines beyond what regulatory compliance deadlines alone would require. DuPont, Corteva, and Chemours collectively settled for USD 1.185 billion with municipal water providers in 2023, with additional settlements pending from other PFAS manufacturer and user defendants whose aggregate financial exposure is estimated in the hundreds of billions of dollars across all classes of PFAS contamination plaintiffs including water utilities, municipalities, property owners, and state environmental agencies. Beyond direct treatment funding, litigation settlement proceeds allocated to state environmental funds and water infrastructure improvement programs in states including California, Michigan, New Jersey, New York, and North Carolina are being channeled into PFAS monitoring, investigation, and treatment programs at contaminated sites and community water systems, creating a geographically distributed and litigation-funded demand stream that amplifies the regulatory compliance-driven market demand for PFAS treatment technologies across multiple application categories and water system sizes.
Scientific Expansion of PFAS Health Evidence, Regulatory Class-Based Restriction of the Broader PFAS Chemical Family, and Growing Public Awareness Intensifying Treatment Demand Beyond Currently Regulated Compounds
The accelerating pace of PFAS toxicological and epidemiological research is continuously expanding the evidence base for adverse human health effects at progressively lower exposure concentrations across an expanding number of individual PFAS compounds beyond the initially regulated perfluorooctanoic acid and perfluorooctane sulfonic acid, creating a regulatory trajectory toward broader class-based PFAS restrictions and lower maximum contaminant levels that is compelling proactive investment in treatment systems capable of addressing the full PFAS chemical family rather than narrowly optimizing performance for the two most studied legacy compounds. The United States Environmental Protection Agency’s designation of perfluorooctanoic acid and perfluorooctane sulfonic acid as hazardous substances under the Comprehensive Environmental Response, Compensation, and Liability Act in April 2024, which triggers site investigation and cleanup obligations at any contaminated location exceeding reportable quantity thresholds, dramatically expands the regulatory addressable market for PFAS remediation treatment beyond drinking water compliance to encompass thousands of industrial facilities, military sites, landfills, and former manufacturing locations not currently subject to drinking water maximum contaminant levels. The European Union’s universal restriction proposal for the entire PFAS chemical class submitted to the European Chemicals Agency by five national authorities in January 2023 under the Registration, Evaluation, Authorisation and Restriction of Chemicals regulation, which would restrict the manufacture, use, and import of essentially all PFAS compounds with limited time-limited derogations for critical uses, if adopted would represent the most sweeping PFAS regulatory action globally and would mandate treatment of PFAS-containing industrial process streams, wastewater discharges, and contaminated environmental media at a scale that dwarfs current drinking water compliance treatment investment requirements, creating a transformative long-term market expansion signal that is already influencing industrial PFAS treatment investment planning and technology procurement decisions by major European manufacturers and industrial operators.
Key Challenges
Treatment Residuals Management Crisis: Concentration and Transfer of PFAS from Water to Solid Waste Streams Without Effective Destruction Creating an Unresolved End-of-Waste-Chain Liability
The most technically and commercially acute challenge confronting the global PFAS water treatment industry is the absence of widely deployed, commercially proven, and cost-effective destruction technology capable of mineralizing the PFAS compounds removed from water and concentrated into treatment residuals including spent granular activated carbon, exhausted ion exchange resin, and reverse osmosis concentrate, creating a critical gap in the PFAS treatment value chain where removal from water is technically achievable but permanent elimination of the PFAS contamination remains largely unresolved at the commercial scale and cost required for routine treatment residuals management. The current dominant practice of disposing spent PFAS-laden granular activated carbon and exhausted ion exchange resin in hazardous waste landfills or high-temperature incinerators represents an interim solution whose long-term environmental liability exposure, regulatory acceptability, and practical capacity are all constrained, with PFAS-loaded landfill disposal generating leachate that perpetuates PFAS release to groundwater at disposal sites, high-temperature incineration potentially generating incomplete combustion products including fluorinated combustion byproducts at temperatures below the approximately 1,100 degrees Celsius required for complete PFAS mineralization, and existing hazardous waste incineration capacity in the United States and Europe projected to be insufficient to handle the volume of PFAS-laden residuals generated by the thousands of water treatment systems coming online to meet regulatory compliance deadlines. The absence of a widely available, affordable, and regulatory-compliant PFAS destruction option creates a growing residuals management cost liability for water utilities and industrial operators that can represent 30% to 50% of total PFAS treatment operating cost and significantly extends the total cost of compliance beyond the capital and operating cost of the removal stage alone, undermining the economic case for some treatment technology investments and creating regulatory and reputational risk for treatment system operators unable to demonstrate a compliant long-term residuals management pathway.
Extreme Analytical Complexity, Evolving Detection Method Requirements, and Cost of PFAS Monitoring at Parts Per Trillion Concentrations Constraining Compliance Verification and Treatment Performance Assessment
The analytical requirements for PFAS compliance monitoring at the parts per trillion concentration levels mandated by the United States Environmental Protection Agency maximum contaminant levels and equivalent European regulatory thresholds impose significant laboratory cost, technical expertise, quality assurance burden, and sample preservation and handling complexity on water utilities and industrial dischargers required to conduct routine compliance monitoring, with the specialized liquid chromatography tandem mass spectrometry analytical methods required for accurate multi-compound PFAS quantification at regulatory threshold concentrations available only at a limited number of certified laboratories globally whose combined analytical capacity is already under strain from the surge in regulatory compliance monitoring demand generated by new maximum contaminant level promulgation. The expanding list of PFAS compounds targeted by regulatory frameworks, from the initial two compounds under early regulatory guidance to six compounds under the United States maximum contaminant level rule and the sum of all PFAS under the European Union drinking water directive, requires increasingly comprehensive and expensive analytical panels whose cost per sample of USD 200 to USD 600 for multi-compound PFAS analysis represents a meaningful operational expense for small and medium water systems required to conduct quarterly or annual compliance monitoring across multiple sample points within their distribution systems. Matrix interference, sample container contamination from fluoropolymer materials in collection equipment, PFAS background contamination in laboratory reagents and environments, and inter-laboratory analytical variability all introduce uncertainty into PFAS compliance monitoring results that complicate treatment performance verification, regulatory enforcement decisions, and litigation-related analytical evidentiary requirements, creating technical disputes between regulators, water utilities, and potentially liable parties that delay compliance response and remediation investment decisions.
Financial Burden on Small and Medium Water Systems, Funding Gap Between Treatment Cost Obligations and Available Rate Base and Grant Financing, and Disproportionate Compliance Cost Impact on Disadvantaged Communities
The distribution of PFAS contamination impacts and compliance cost obligations across the United States and European water utility sector is deeply inequitable, with a disproportionate share of affected drinking water systems concentrated among small and medium water systems serving populations below 10,000 that lack the financial scale, technical staff capacity, rate base revenue, and capital market access required to finance, design, procure, construct, and operate sophisticated PFAS treatment systems without substantial external financial assistance, creating a funding gap between mandated compliance obligations and available financial capacity that threatens service continuity, forces financial hardship on ratepayers in lower-income communities, and requires substantial public subsidy allocation to prevent a two-tiered water quality outcome in which large metropolitan systems rapidly achieve compliance while smaller systems serving rural and economically disadvantaged populations fall behind due to financing constraints. The United States Environmental Protection Agency estimates that approximately 68% of public water systems exceeding PFAS maximum contaminant levels serve fewer than 10,000 people, with many of these small systems generating annual revenues of less than USD 1 million that are wholly inadequate to service the debt required to finance treatment capital expenditure of USD 500,000 to USD 5 million depending on system size, PFAS concentration levels, and treatment technology selected, making federal and state grant funding through the Drinking Water State Revolving Fund, the Bipartisan Infrastructure Law’s USD 9 billion PFAS and emerging contaminant funding allocation, and litigation settlement proceeds the primary financing mechanisms for small system PFAS compliance investment. The geographic concentration of PFAS-impacted small water systems in communities adjacent to former military installations, legacy fluorochemical manufacturing sites, and agricultural areas receiving PFAS-containing biosolids creates environmental justice dimensions to PFAS compliance financing that are intensifying regulatory and political attention to equitable funding allocation across the PFAS treatment investment programs being deployed through the forecast period.
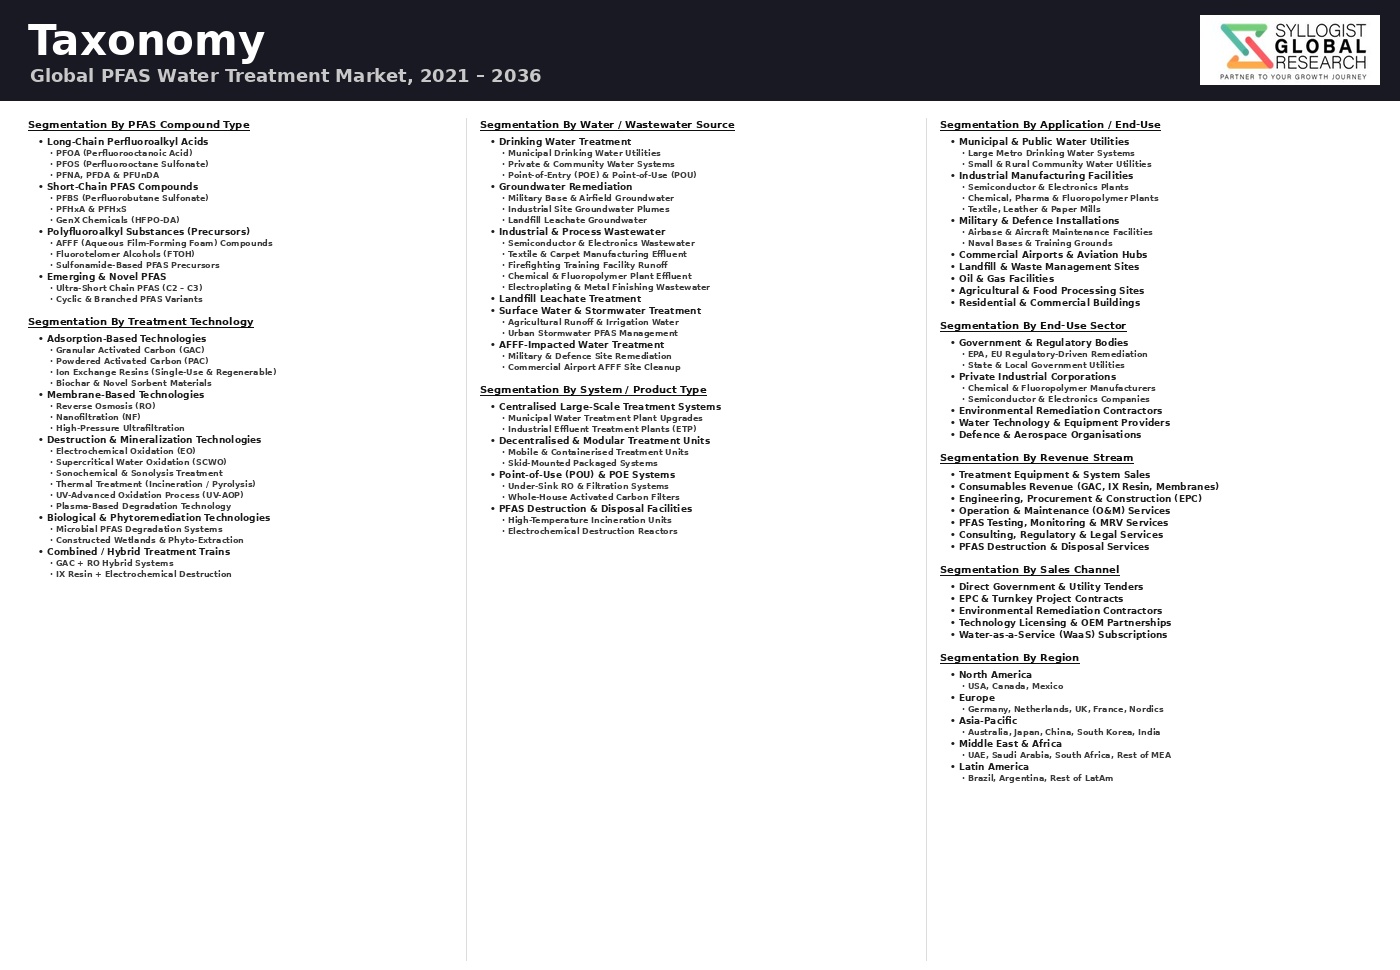
Market Segmentation
- Segmentation By Treatment Technology
- Granular Activated Carbon (GAC) Adsorption
- Powdered Activated Carbon (PAC) Adsorption
- Ion Exchange Resins (Single-Use and Regenerable PFAS-Selective Resins)
- High-Pressure Membrane Filtration (Nanofiltration and Reverse Osmosis)
- Electrochemical Oxidation (Boron-Doped Diamond Electrode Systems)
- Ultraviolet-Activated Persulfate and Advanced Oxidation Processes
- Sonochemical and Sonophotochemical Destruction
- Supercritical Water Oxidation
- Thermal Treatment and High-Temperature Incineration of PFAS Residuals
- Smoldering Combustion and In-Situ Thermal Remediation
- Foam Fractionation and Selective Concentration Technologies
- Others
- Segmentation By PFAS Compound Class
- Long-Chain Perfluoroalkyl Carboxylic Acids (PFOA, PFNA, and Others)
- Long-Chain Perfluoroalkane Sulfonic Acids (PFOS, PFHxS, and Others)
- Short-Chain Perfluoroalkyl Carboxylic Acids (PFBA, PFPeA, PFHxA, and Others)
- Short-Chain Perfluoroalkane Sulfonic Acids (PFBS, PFPeS, and Others)
- Fluorotelomer Sulfonates and Carboxylates (Precursor PFAS)
- Polyfluoroalkyl Substances (Precursors and Transformation Products)
- PFAS Sum Parameters (Total PFAS Class Regulatory Compliance)
- Segmentation By Water and Wastewater Matrix
- Drinking Water (Surface Water, Groundwater, and Blended Sources)
- Groundwater Remediation and Pump-and-Treat Systems
- Industrial Process Water and Cooling Water
- Industrial Wastewater and Process Effluent
- Landfill Leachate
- Aqueous Film-Forming Foam Impacted Stormwater and Runoff
- Municipal Wastewater and Biosolids Processing
- Ion Exchange Regeneration Brine and Reverse Osmosis Concentrate
- Others
- Segmentation By End User
- Municipal and Public Drinking Water Utilities
- Private and Investor-Owned Water Utilities
- Military Installations and Defense Agencies
- Civilian Airports and Aviation Facilities
- Industrial Manufacturers (Fluoropolymer, Semiconductor, Textile, and Electroplating)
- Oil and Gas Operators
- Environmental Remediation Contractors and Site Operators
- Municipal Wastewater Treatment Authorities
- Landfill Operators
- Others
- Segmentation By Project Type
- New Greenfield Treatment System Installation
- Retrofit and Upgrade of Existing Water Treatment Plants
- Contaminated Site and Groundwater Remediation
- Mobile and Temporary Emergency Treatment Deployments
- Treatment Residuals Destruction and Disposal
- Others
- Segmentation By System Scale
- Large Scale (Above 10 Million Gallons per Day)
- Medium Scale (1 to 10 Million Gallons per Day)
- Small Scale (Below 1 Million Gallons per Day)
- Point-of-Entry and Point-of-Use Household Systems
- Segmentation By Region
- North America
- Europe
- Asia-Pacific
- Middle East and Africa
- Latin America
All market revenues are presented in USD
Historical Year: 2021-2024 | Base Year: 2025 | Estimated Year: 2026 | Forecast Period: 2027-2034
Key Questions this Study Will Answer
- What is the total global market valuation of the PFAS Water Treatment Technologies Market in the base year 2025, and what is the projected market size and compound annual growth rate through 2034, disaggregated by treatment technology including granular activated carbon, ion exchange resins, nanofiltration and reverse osmosis, electrochemical oxidation, advanced oxidation processes, and thermal destruction, by water matrix including drinking water, groundwater remediation, industrial wastewater, landfill leachate, and aqueous film-forming foam impacted water, and by end user including municipal utilities, military installations, industrial manufacturers, airports, and environmental remediation contractors, to enable treatment technology developers, water utilities, environmental engineering firms, litigation settlement fund administrators, government infrastructure program managers, and infrastructure investors to quantify demand by segment and prioritize technology investment and market entry strategies through 2034?
- What are the technical performance benchmarks, capital and operating cost profiles, PFAS compound class treatment efficiency including short-chain and long-chain PFAS removal rates, regeneration and residuals management requirements, and commercial deployment scale of the leading PFAS removal and destruction technologies including granular activated carbon, PFAS-selective ion exchange resins from Purolite and Lanxess, nanofiltration and reverse osmosis, electrochemical oxidation using boron-doped diamond electrodes from Aclarity and Axine, supercritical water oxidation, ultraviolet persulfate advanced oxidation, and smoldering combustion, and what combinations of removal and destruction technologies are achieving the best overall treatment outcomes including PFAS mineralization completeness, treatment residuals volume minimization, and total cost of compliance across different source water matrices and regulatory concentration target scenarios?
- How are the United States Environmental Protection Agency’s 2024 PFAS National Primary Drinking Water Regulation maximum contaminant levels of 4 parts per trillion for perfluorooctanoic acid and perfluorooctane sulfonic acid and the European Union recast Drinking Water Directive total PFAS sum limit of 100 nanograms per liter driving compliance capital expenditure investment timelines, treatment technology selection decisions, engineering procurement and construction contracting strategies, and technology supply chain capacity scaling across the United States and European water utility sectors, and what are the estimated compliance investment requirements on a system-size, geographic, and technology pathway basis across the approximately 6,700 to 9,600 United States public water systems and thousands of European utilities projected to require treatment installation to achieve regulatory compliance by their respective compliance deadlines?
- What is the scale, geographic distribution, site characterization status, treatment technology deployment, and long-term remediation cost obligation of the military installation, civilian airport, former fluorochemical manufacturing, and industrial PFAS-contaminated site remediation market in the United States and globally, including the Department of Defense’s identified contaminated site portfolio and the USD 2.4 billion in PFAS investigation and remediation investment committed through fiscal year 2025, and how are litigation settlement proceeds from the 3M USD 10.3 billion and DuPont, Corteva, and Chemours USD 1.185 billion settlements being allocated, administered, and deployed into treatment infrastructure procurement to accelerate PFAS remediation beyond what regulatory compliance timelines alone would mandate?
- What financing mechanisms including the Bipartisan Infrastructure Law USD 9 billion PFAS and emerging contaminant allocation within the Drinking Water State Revolving Fund, state-level PFAS treatment grant and low-interest loan programs, litigation settlement fund disbursement processes, and potential new federal appropriations are available to address the documented funding gap between PFAS treatment compliance cost obligations and the financial capacity of small and medium water systems serving disadvantaged communities, and how are technology developers, engineering firms, and water sector financial institutions structuring managed service, treatment-as-a-service, performance contracting, and public-private partnership delivery models to make PFAS treatment accessible to financially constrained water systems that cannot finance conventional capital procurement approaches within the compliance implementation timelines mandated by current and emerging PFAS regulatory frameworks?
- Product Definition
- Research Methodology
- Research Design & Framework
- Overall Research Approach: Descriptive, Exploratory & Quantitative Mixed-Method Design
- Market Definition & Scope Boundaries: What is Included and Excluded
- Segmentation Framework
- Key Research Assumptions & Limitations
- Secondary Research
- Primary Research Design & Execution
- Data Triangulation & Validation
- Market Sizing & Forecasting Methodology
- Competitive Intelligence Methodology
- Quality Assurance & Peer Review
- Definitions, Abbreviations & Data Notes
- Research Design & Framework
- Executive Summary
- Market Snapshot & Headline Numbers
- Key Findings & Research Highlights
- Market Dynamics
- Regional Market Summary
- Competitive Landscape Snapshot
- Technology & Innovation Highlights
- Market Dynamics
- Drivers
- Restraints
- Opportunities
- Challenges
- Porter’s Five Forces Analysis
- PESTLE Analysis
- Market Trends & Developments
- Emerging Trends
- Technological Developments
- Regulatory & Policy Changes
- Supply Chain & Sourcing Trends
- Manufacturing & Process Trends
- Investment & Funding Activity
- Sustainability & ESG Trends
- Risk Assessment Framework
- Regulatory Uncertainty & Maximum Contaminant Level (MCL) Revision Risk
- Technology Performance, Selectivity & Residual Contamination Risk
- PFAS-Laden Waste Disposal, Destruction & Liability Risk
- Market & Financing Risk for Large-Scale PFAS Remediation Infrastructure
- Reputational, Legal & Environmental Compliance Risk for Utilities & Polluters
- Regulatory Framework & Standards
- US EPA PFAS National Primary Drinking Water Regulation (NPDWR): MCL for PFOA, PFOS, PFNA, PFHxS, HFPO-DA (GenX) & PFBS Mixtures
- European Union PFAS Drinking Water Directive (EU 2020/2184), REACH Restriction & POP Regulation (EU 2019/1021) Framework
- PFAS Remediation Standards for Groundwater, Surface Water, Soil & Sediment (EPA CERCLA, RCRA & Superfund Site Standards)
- PFAS Wastewater Effluent Guidelines, Industrial Discharge Limits & AFFF (Aqueous Film Forming Foam) Phase-Out Regulations
- PFAS Destruction, Ultimate Disposal & Concentrated Waste Management Regulations (Incineration Standards, Landfill Leachate Rules)
- Global PFAS Water Treatment Technologies Market Outlook
- Market Size & Forecast by Value
- Market Size & Forecast by Volume (Treatment Capacity Installed, m3/day)
- Market Size & Forecast by Treatment Technology
- Granular Activated Carbon (GAC) Adsorption
- Powdered Activated Carbon (PAC) Adsorption
- Ion Exchange Resin (IEX): Single-Use & Regenerable (Strong Anion, PFAS-Selective)
- High-Pressure Membrane Filtration: Nanofiltration (NF) & Reverse Osmosis (RO)
- Low-Pressure Membrane Filtration: Ultrafiltration (UF) & Microfiltration (MF) as Pre-Treatment
- Advanced Oxidation Processes (AOP): Electrochemical Oxidation, UV/Ozone, Persulfate & Sonochemical Destruction
- Sonochemical & Ultrasonic PFAS Destruction
- Plasma-Based PFAS Destruction (Non-Thermal & Thermal Plasma)
- Supercritical Water Oxidation (SCWO) for PFAS Destruction
- Foam Fractionation & Selective PFAS Concentration Technology
- Bioremediation & Biodegradation-Based PFAS Treatment (Emerging)
- Permeable Reactive Barrier (PRB) & In-Situ Groundwater PFAS Treatment
- Market Size & Forecast by PFAS Compound Targeted
- Long-Chain Perfluoroalkyl Carboxylic Acids: PFOA & PFNA
- Long-Chain Perfluoroalkyl Sulphonic Acids: PFOS & PFHxS
- Short-Chain PFAS: PFBS, PFBA, PFPeA & PFHxA
- Next-Generation & Replacement PFAS: GenX (HFPO-DA), ADONA & F-53B
- Precursor PFAS & Polyfluoroalkyl Substances (Pre-Cursor to Terminal PFAS)
- Total PFAS (Sum Parameter) Treatment: Broad-Spectrum Removal Targets
- Market Size & Forecast by Application / Water Matrix
- Drinking Water Treatment: Municipal & Public Water Supply
- Point-of-Use (POU) & Point-of-Entry (POE) Residential & Commercial Treatment
- Groundwater Remediation (Contaminated Plume & Pump-and-Treat Systems)
- Industrial & Municipal Wastewater Treatment (PFAS-Laden Effluent)
- Landfill Leachate Treatment (PFAS-Concentrated Leachate from PFAS-Contaminated Waste)
- AFFF-Contaminated Soil & Site Remediation Groundwater Treatment
- Military Base, Airport & Fire Training Site Groundwater Treatment
- Industrial Process Water & Reuse (Semiconductor, Textile & Paper Industry)
- Market Size & Forecast by Component
- Treatment Media & Consumables (Activated Carbon, Ion Exchange Resin, Membranes)
- Treatment Equipment & Systems (Adsorption Vessels, Membrane Units, AOP Reactors)
- PFAS Analytical & Monitoring Instruments (LC-MS/MS, Total Oxidisable Precursor Assay)
- PFAS Destruction & Ultimate Disposal Services & Systems
- Software, Digital Monitoring & Remote Treatment Management Platforms
- Services (Design, Installation, O&M, Regeneration & Waste Management)
- Market Size & Forecast by System Scale
- Large Municipal & Utility-Scale Treatment Systems (Above 10,000 m3/day)
- Medium Industrial & Remediation Systems (1,000 to 10,000 m3/day)
- Small & Decentralised Systems (100 to 1,000 m3/day)
- Point-of-Use & Point-of-Entry Household & Commercial Systems (Below 100 m3/day)
- Market Size & Forecast by End-User
- Municipal Water & Wastewater Utilities
- Industrial Facilities (Semiconductor, Aerospace, Chemical, Textile & Paper Manufacturers)
- Military Installations, Airports & Fire Training Facilities
- Environmental Remediation & Brownfield Site Operators
- Residential, Commercial Building Owners & Property Developers
- Government & Regulatory Agencies (Superfund, CERCLA & Site Cleanup Programmes)
- Market Size & Forecast by Sales Channel
- Direct OEM & Technology Licensor Supply to Utilities & Industrial Operators
- Environmental Engineering, EPC & Remediation Contractor Channel
- Distributor & Specialty Water Treatment Equipment Dealer Network
- Managed Treatment Service, Build-Operate-Transfer (BOT) & O&M Contract Channel
- North America PFAS Water Treatment Technologies Market Outlook
- Market Size & Forecast
- By Value
- By Volume (Treatment Capacity Installed, m3/day)
- By Treatment Technology
- By PFAS Compound Targeted
- By Application / Water Matrix
- By Component
- By System Scale
- By End-User
- By Country
- By Sales Channel
- Market Size & Forecast
- Europe PFAS Water Treatment Technologies Market Outlook
- Market Size & Forecast
- By Value
- By Volume (Treatment Capacity Installed, m3/day)
- By Treatment Technology
- By PFAS Compound Targeted
- By Application / Water Matrix
- By Component
- By System Scale
- By End-User
- By Country
- By Sales Channel
- Market Size & Forecast
- Asia-Pacific PFAS Water Treatment Technologies Market Outlook
- Market Size & Forecast
- By Value
- By Volume (Treatment Capacity Installed, m3/day)
- By Treatment Technology
- By PFAS Compound Targeted
- By Application / Water Matrix
- By Component
- By System Scale
- By End-User
- By Country
- By Sales Channel
- Market Size & Forecast
- Latin America PFAS Water Treatment Technologies Market Outlook
- Market Size & Forecast
- By Value
- By Volume (Treatment Capacity Installed, m3/day)
- By Treatment Technology
- By PFAS Compound Targeted
- By Application / Water Matrix
- By Component
- By System Scale
- By End-User
- By Country
- By Sales Channel
- Market Size & Forecast
- Middle East & Africa PFAS Water Treatment Technologies Market Outlook
- Market Size & Forecast
- By Value
- By Volume (Treatment Capacity Installed, m3/day)
- By Treatment Technology
- By PFAS Compound Targeted
- By Application / Water Matrix
- By Component
- By System Scale
- By End-User
- By Country
- By Sales Channel
- Market Size & Forecast
- Country-Wise* PFAS Water Treatment Technologies Market Outlook
- Market Size & Forecast
- By Value
- By Volume (Treatment Capacity Installed, m3/day)
- By Treatment Technology
- By PFAS Compound Targeted
- By Application / Water Matrix
- By Component
- By System Scale
- By End-User
- By Country
- By Sales Channel
- Market Size & Forecast
*Countries Analyzed in the Syllogist Global Research Portfolio: United States, Canada, Germany, France, United Kingdom, Netherlands, Sweden, Denmark, Finland, Norway, Belgium, Italy, Spain, Australia, Japan, South Korea, China, India, Brazil, Argentina, South Africa, New Zealand, Singapore
- Technology Landscape & Innovation Analysis
- Granular Activated Carbon (GAC) & Ion Exchange (IEX) Adsorption Technology Deep-Dive
- GAC Media Selection for PFAS Removal: Bituminous, Lignite & Coconut-Shell Carbon Characterisation, BET Surface Area, Pore Size Distribution & PFAS Compound-Specific Capacity Comparison
- GAC Bed Design, Empty Bed Contact Time (EBCT) Optimisation & Breakthrough Curve Modelling for PFOA, PFOS & Short-Chain PFAS in Municipal Drinking Water Applications
- PFAS-Selective Ion Exchange Resin Technology: Single-Use vs. Regenerable Resin Performance, Competing Anion Interference, Total Organic Carbon (TOC) Fouling & Regenerant Disposal Management
- GAC Thermal Reactivation Technology: Rotary Kiln & Multiple Hearth Furnace Reactivation Efficiency, PFAS Destruction Temperature Requirements & Mercury & PFAS Off-Gas Control
- Combined GAC + IEX Treatment Train Design: Sequential & Parallel Configuration Optimisation for Broad-Spectrum PFAS Removal Achieving Sub-MCL Compliance in Complex Water Matrices
- High-Pressure Membrane (NF & RO) Technology for PFAS Removal
- Advanced Oxidation & Electrochemical PFAS Destruction Technology
- Plasma-Based, SCWO & Emerging Non-Thermal PFAS Destruction Technology
- Foam Fractionation, PFAS Concentration & Pre-Treatment Technology
- In-Situ Groundwater Remediation, PRB & Soil Treatment Technology for PFAS
- PFAS Analytical Detection, Monitoring & Digital Treatment Management Technology
- Patent & IP Landscape in PFAS Water Treatment Technologies
- Granular Activated Carbon (GAC) & Ion Exchange (IEX) Adsorption Technology Deep-Dive
- Value Chain & Supply Chain Analysis
- Activated Carbon, Ion Exchange Resin & Membrane Manufacturing Supply Chain
- AOP Reagent, Electrode & Destruction Technology Equipment Supply Chain
- PFAS Analytical Instrument, Monitoring Sensor & Laboratory Service Supply Chain
- PFAS Water Treatment OEM, System Integrator & Technology Licensor Landscape
- Environmental Engineering Contractor, EPC & Remediation Service Provider Channel
- Utility, Industrial End-User & Government Agency Procurement & Funding Channel
- PFAS Waste Concentrate, Spent Media Disposal, Destruction & Circular Management
- Pricing Analysis
- GAC Adsorption System Capital, Media & Reactivation Cost Analysis
- PFAS-Selective Ion Exchange Resin System Pricing Analysis
- NF & RO Membrane System Capital & Operating Cost Analysis for PFAS Removal
- Advanced Oxidation & Electrochemical Destruction System Pricing Analysis
- Managed Treatment Service, BOT & O&M Contract Pricing Analysis
- Total Cost of PFAS Compliance: Levelised Treatment Cost per m3 by Technology Route & Application
- Sustainability & Environmental Analysis
- Lifecycle Assessment (LCA) of PFAS Water Treatment Technology Routes: Energy, Carbon & Chemical Intensity Comparison
- PFAS Destruction Verification, Mineralisation Completeness & Toxic By-Product Formation Risk
- Spent GAC & Ion Exchange Resin Waste Management: Reactivation, Incineration & Landfill Leachate Re-Contamination Risk
- Environmental Justice, Community Health Impact & Disproportionate PFAS Exposure Burden in Affected Populations
- Regulatory-Driven Sustainability, Polluter-Pays Principle & PFAS Liability Cost Allocation for Industry & Utilities
- Competitive Landscape
- Market Structure & Concentration
- Market Consolidation Level (Fragmented vs. Consolidated by Technology Type & Geography)
- Top 10 Players Market Share
- HHI (Herfindahl-Hirschman Index) Concentration Analysis
- Competitive Intensity Map by Treatment Technology, Application & Geography
- Player Classification
- Integrated Water Technology Companies with Full PFAS Treatment Portfolio
- Specialist Activated Carbon & Ion Exchange Media Manufacturers
- Membrane Technology & High-Pressure Filtration System Providers
- Advanced Oxidation & Electrochemical PFAS Destruction Technology Specialists
- Plasma-Based, SCWO & Emerging PFAS Destruction Technology Companies
- Environmental Engineering, Remediation EPC & Managed Treatment Service Providers
- PFAS Analytical Instrument, Monitoring & Digital Platform Providers
- Point-of-Use & Point-of-Entry Residential Treatment System Manufacturers
- Competitive Analysis Frameworks
- Market Share Analysis by Treatment Technology, Application & Region
- Company Profile
- Company Overview & Headquarters
- PFAS Water Treatment Products & Technology Portfolio
- Key Customer Relationships & Reference Installations
- Manufacturing Footprint & Production Capacity
- Revenue (PFAS Treatment Segment) & Backlog
- Technology Differentiators & IP
- Key Strategic Partnerships, JVs & M&A Activity
- Recent Developments (Contract Wins, Capacity Expansion, Product Launches)
- SWOT Analysis
- Strategic Focus Areas & Roadmap
- Competitive Positioning Map (Technology Capability vs. Market Penetration)
- Key Company Profiles
- Market Structure & Concentration
- Technology Landscape & Innovation Analysis
- Strategic Output
- Market Opportunity Matrix: By Treatment Technology, PFAS Compound, Application, System Scale & Geography
- White Space Opportunity Analysis
- Strategic Output
- Strategic Recommendations
- Product Portfolio & Technology Investment Strategy
- Manufacturing & Operational Excellence Strategy
- Geographic Expansion & Localisation Strategy
- Customer & End-User Engagement Strategy
- Partnership, M&A & Ecosystem Strategy
- Sustainability & Circular Economy Strategy
- Risk Mitigation & Future Roadmap
- Strategic Priority Matrix & Roadmap
- Near-term (2025–2028)
- Mid-term (2029–2032)
- Long-term (2033–2037)