Market Definition
The global copper market covers the extraction, refining, fabrication, trade, and end-use consumption of copper metal and its principal alloy and semi-fabricated forms. It spans the full vertical chain from copper ore mining of sulfide and oxide deposits through concentration, smelting, and electrolytic refining to the production of cathodes, wire rod, billets, plates, sheets, strip, foil, tubes, and copper alloy mill products such as brass, bronze, and copper-nickel. The market also includes recycled copper recovered from end-of-life scrap and new manufacturing scrap, which now constitutes a meaningful share of refined output. End-use categories span electrical wire and cable for power generation, transmission, and distribution, building wire, and consumer electronics; building construction including plumbing, HVAC, and roofing; transportation covering internal-combustion vehicles, electric vehicles, rail, and aerospace; industrial machinery; and consumer durables. Copper’s combination of high electrical and thermal conductivity, ductility, corrosion resistance, and antimicrobial properties makes it indispensable to electrification, renewable energy infrastructure, and modern manufacturing. The market is tightly linked to global commodity exchanges including the LME, COMEX, and SHFE, where physical premiums, treatment and refining charges, and exchange-traded prices determine producer margins and consumer procurement strategies. Trade flows are concentrated, with Chile and Peru anchoring mined output, China dominating refined production and consumption, and the United States, Europe, India, and Southeast Asia driving incremental demand. For the purpose of this study, the global copper market is defined to include refined copper of Grade A cathode quality, copper semi-fabricated products, copper-bearing scrap, and copper alloys, measured in metric tons of contained copper and in USD value at refined equivalent.
Market Insights
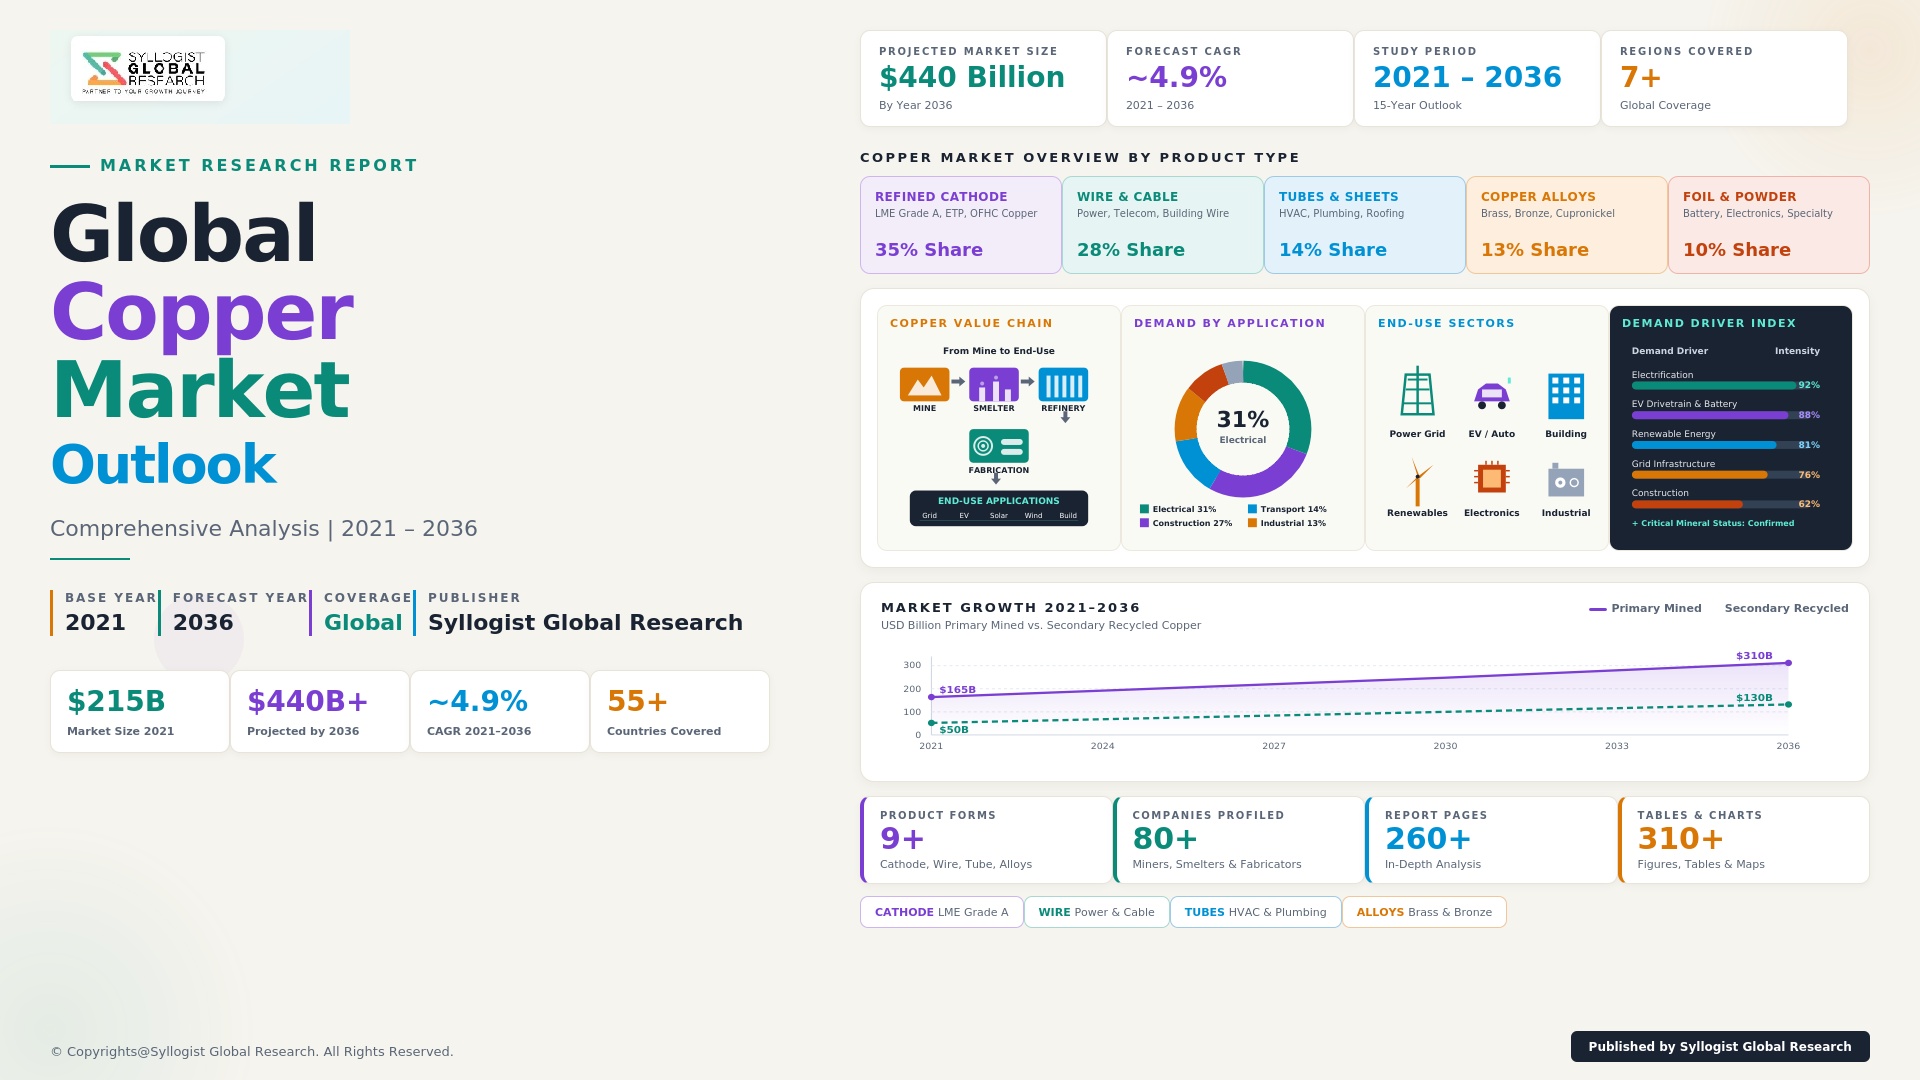
The global refined copper market is valued at approximately USD 312 billion in 2025, with refined copper consumption close to 28.4 million metric tons. Demand is forecast to expand at a compound annual rate of 4.8% through 2032, and electrification-linked end uses are contributing more than 65% of incremental tonnage. Wire and cable applications continue to dominate, accounting for nearly 71% of refined copper consumption, followed by building and construction at 9.2%, industrial machinery at 7.4%, and transport at 6.6%. Grid modernization investments, particularly in transmission infrastructure for renewable integration, are driving cable demand, with high-voltage AC cable consuming an average of 495 kg of copper per kilometre depending on conductor specification.
Electric vehicles and renewable energy systems are reshaping the copper demand curve in ways previous demand cycles cannot benchmark. A battery electric vehicle uses approximately 83 kg of copper compared with 23 kg for a conventional internal-combustion vehicle, while a plug-in hybrid sits at roughly 60 kg. Charging infrastructure adds another layer, with a single 350 kW DC fast-charging unit containing 25 kg of copper, and AC home chargers averaging 2.2 kg per unit. Offshore wind turbines consume close to 12.4 tons of copper per megawatt installed, and utility-scale solar PV systems require around 5.5 tons of copper per megawatt. The combined effect is structural, not cyclical: by 2030, energy-transition end uses alone are projected to account for 5.1 million metric tons of annual copper demand, up from 1.8 million metric tons in 2022. This shift is also reorienting fabricator footprints, with new wire rod and busbar capacity additions clustering around EV manufacturing hubs in the United States, Mexico, Hungary, and Indonesia.
On the supply side, the market is increasingly constrained by long mine lead times, falling head grades, and rising capital intensity. Average head grades at the world’s largest open-pit copper mines have declined from 0.97% in 2005 to approximately 0.51% in 2025, requiring nearly twice the material movement per ton of contained copper. Chile and Peru together account for 38% of global mined output at 8.3 million metric tons combined, though both jurisdictions face water-stress, royalty, and permitting headwinds. China refines roughly 46% of global copper and consumes about 54%, creating a concentrated demand-supply pivot that exposes western fabricators to single-country price-setting risk. Treatment and refining charges for spot concentrate fell to USD 18.4 per ton in early 2025, signaling tight concentrate availability, while LME copper traded above USD 9,650 per ton on average through the first half of the year.
Recycled copper now supplies an estimated 32% of global refined and direct-melt copper demand, and this share is expected to rise above 40% by 2035 as collection systems mature in India, Southeast Asia, and Africa. Secondary copper smelting capacity additions of 1.4 million tons per year are under construction across China, Belgium, Germany, and the United States, narrowing the gap between primary and secondary supply economics. ESG-linked procurement is also reshaping flow patterns: low-carbon copper cathode produced using renewable-powered hydromet routes commands a premium of USD 135 per ton over conventional Grade A material in 2025, with European cable makers, automotive OEMs, and hyperscale data center operators executing multi-year green copper offtake agreements. Producers that can certify scope-1 and scope-2 emissions below 1.5 tons of CO2 per ton of cathode are securing preferential financing terms and long-dated supply contracts, anchoring a new competitive dimension that supplements traditional cash-cost positioning.
Key Drivers
Electrification of Transport and Grid Infrastructure: The global pivot toward electrification is the single largest structural pull on copper demand. EV sales reached 17.1 million units in 2024 and are forecast to cross 31 million units by 2030, each carrying three to four times the copper intensity of a comparable ICE vehicle. Concurrently, transmission and distribution networks are absorbing record copper volumes as utilities reinforce grids to accommodate intermittent renewable inputs, EV charging loads, and rising peak demand from data centers and electrified heating.
Renewable Energy Capacity Additions: Annual renewable capacity additions reached 585 GW in 2024 and are projected to maintain a run rate above 700 GW through 2030. Solar PV, onshore wind, and particularly offshore wind are copper-intensive, with offshore arrays consuming close to five times more copper per megawatt than thermal generation. Battery energy storage systems, expected to install 215 GWh annually by 2027, add another structural vector of copper demand that is independent of generation technology choices.
Data Center Expansion and AI-Led Power Buildout: Hyperscale and AI-optimized data centers are emerging as a third structural demand vector. Each MW of data center capacity requires approximately 27 tons of copper for power distribution, cooling loops, and busbar systems. With global data center capacity forecast to grow at 19% annually through 2028, copper consumption from this segment alone is projected to add 480,000 metric tons of annual demand by 2030, much of it concentrated in North America, Ireland, and Singapore.
Key Challenges
Mine Grade Decline and Project Lead Times: Mined copper grades have fallen 47% over two decades, requiring more energy, water, and waste handling per ton of cathode. New greenfield projects now require 16 to 17 years from discovery to first production, and capital intensity exceeds USD 23,000 per annual ton of new copper capacity. This structural lag means supply cannot respond rapidly to demand shocks, leaving the market exposed to extended price spikes and concentrate scarcity windows.
Geopolitical Concentration and Trade Friction: Mined supply is concentrated in Chile, Peru, the DRC, and Zambia, while refining and fabrication capacity is dominated by China. Recent royalty changes in Chile, mining tax stability disputes in Peru, and DRC export licensing reforms have introduced execution risk. Critical mineral policy frameworks in the United States, the European Union, and Japan are encouraging supply diversification, but reshoring smelting capacity carries 25% to 35% higher operating costs than incumbent low-cost locations, slowing the pace of geographic rebalancing.
Water Stress and Social License: Approximately 73% of major copper mines operate in regions classified as high or extremely high baseline water stress. Communities adjacent to operations in Chile’s Atacama, Peru’s southern highlands, and the central Andes are increasingly pushing back on water allocation, tailings management, and indigenous land use. Permitting delays linked to social license disputes have stalled an estimated 4.2 million tons per year of pipeline capacity, deepening the medium-term supply gap and elevating ESG risk premiums on producer financing.
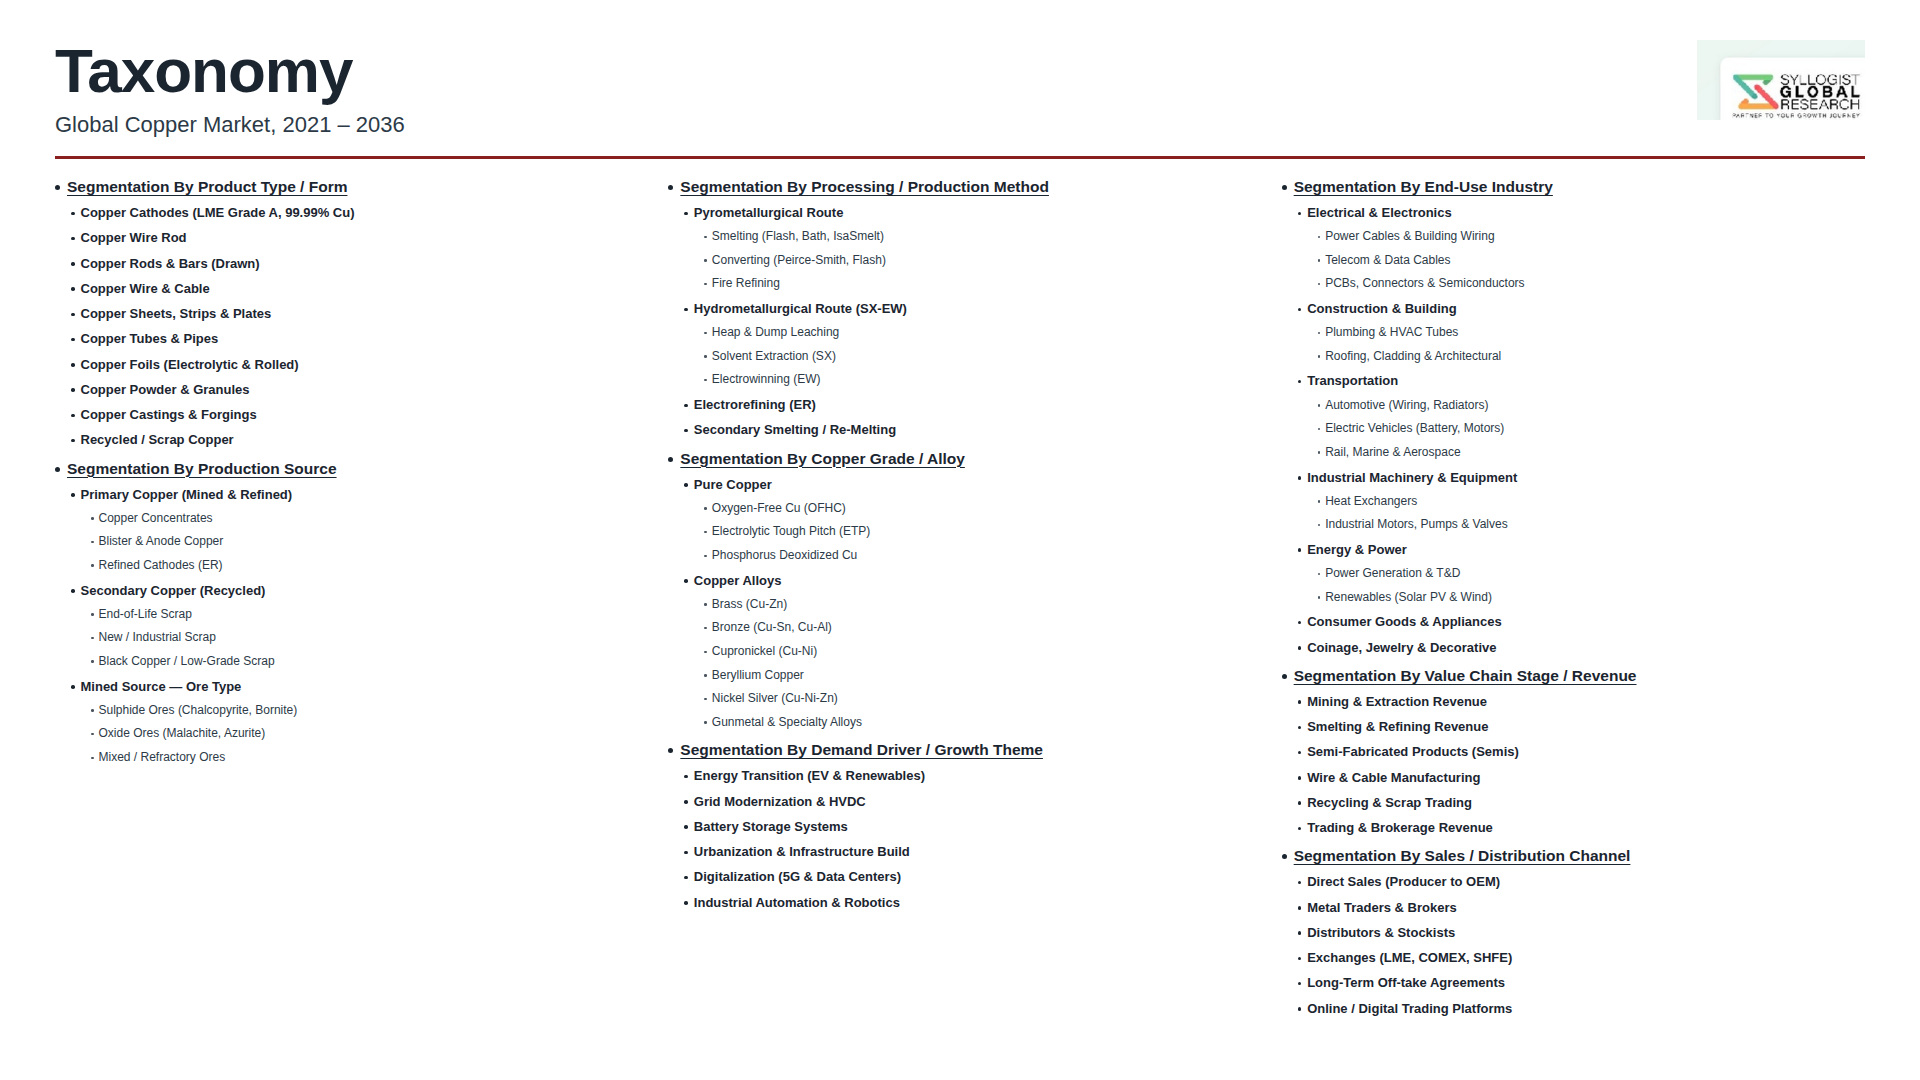
Market Segmentation
- By Product Type
- Refined Copper (Grade A Cathode)
- Copper Wire Rod
- Copper Tubes and Pipes
- Copper Plates, Sheets, and Strip
- Copper Foil
- Copper Alloys (Brass, Bronze, Copper-Nickel)
- By Production Process
- Pyrometallurgical Route (Smelting and Refining)
- Hydrometallurgical Route (SX-EW)
- Secondary (Recycled) Route
- By Source
- Primary (Mined Concentrate)
- Secondary (Scrap and Recycled)
- By End-Use Industry
- Electrical and Electronics
- Building and Construction
- Transportation
- Industrial Machinery and Equipment
- Consumer and General Products
- By Application
- Power Cables and Wiring
- Electric Vehicles and EV Charging Infrastructure
- Renewable Energy Systems (Solar PV, Wind, BESS)
- Plumbing and HVAC
- Data Center Power and Cooling Infrastructure
- Industrial Motors, Transformers, and Generators
- By Grade and Form
- Electrolytic Tough Pitch (ETP) Copper
- Oxygen-Free Copper (OFC and OFE)
- Phosphorus-Deoxidized Copper
- Alloyed and Specialty Grades
- By Region
- North America
- Europe
- Asia Pacific
- Latin America
- Middle East and Africa
Key Questions this Study Will Answer
- What is the current market value and projected growth trajectory of the global copper market through 2032 across primary and secondary supply routes, and how will refined copper consumption evolve by end-use segment?
- How will EV penetration, grid modernization, renewable capacity additions, and AI-led data center buildout reshape refined copper demand patterns at the regional and country level over the next decade?
- Which copper producers and integrated miners are best positioned to capture pricing premiums from low-carbon cathode certification and ESG-linked long-term offtake agreements with OEMs and utilities?
- What is the medium-term outlook for mine supply, treatment and refining charges, and concentrate availability given declining head grades, water-stress constraints, and prolonged permitting timelines?
- How is the scrap and secondary refining ecosystem evolving, and which geographies will dominate circular copper flows, recycling rates, and direct-melt fabrication economics by 2035?
- What strategic responses are fabricators, utilities, and OEMs adopting to mitigate single-country smelter concentration risk and the structural exposure to China’s refined output position?
- How are trade policy shifts, critical minerals frameworks, royalty regime changes, and indigenous consultation requirements affecting investment economics across the key producing jurisdictions of Chile, Peru, the DRC, Zambia, Indonesia, and Mongolia?
- Product Definition
- Research Methodology
- Research Design & Framework
- Overall Research Approach: Descriptive, Exploratory & Quantitative Mixed-Method Design
- Market Definition & Scope Boundaries: What is Included and Excluded
- Segmentation Framework
- Key Research Assumptions & Limitations
- Secondary Research
- Primary Research Design & Execution
- Data Triangulation & Validation
- Market Sizing & Forecasting Methodology
- Competitive Intelligence Methodology
- Quality Assurance & Peer Review
- Definitions, Abbreviations & Data Notes
- Research Design & Framework
- Executive Summary
- Market Snapshot & Headline Numbers
- Key Findings & Research Highlights
- Market Dynamics
- Regional Market Summary
- Competitive Landscape Snapshot
- Technology & Innovation Highlights
- Market Dynamics
- Drivers
- Restraints
- Opportunities
- Challenges
- Porter’s Five Forces Analysis
- PESTLE Analysis
- Market Trends & Developments
- Emerging Trends
- Technological Developments
- Regulatory & Policy Changes
- Supply Chain, Concentrate Trade & Sourcing Trends
- Smelting, Refining & Fabrication Process Trends
- Investment, Mine Project Pipeline & Funding Activity
- Sustainability & ESG Trends
- Risk Assessment Framework
- Ore Grade Decline, Resource Depletion & Mine Operational Continuity Risk
- Commodity Price Volatility, LME Hedging & Treatment / Refining Charge (TC/RC) Risk
- Regulatory, Permitting, Indigenous Community & Cross-Jurisdictional Mining Code Risk
- Geopolitical, Trade Tariff, Export Restriction & Concentrate Logistics Risk
- ESG, Tailings Management, Water Stewardship & Smelter Decarbonisation Risk
- Regulatory Framework & Standards
- National Mining Codes, Concentrate Export Controls & Domestic Beneficiation Mandates Across Copper-Producing Jurisdictions
- LME, COMEX & SHFE Exchange Trading, Warehousing & Grade A Cathode Quality Standards
- Environmental, Tailings Storage Facility (Global Industry Standard on Tailings Management) & Water Discharge Standards for Copper Mining
- Smelter Emission (SO2, Arsenic, Mercury, Particulate) & Industrial Operational Compliance Standards
- Responsible Sourcing, Copper Mark, ICMM Performance Expectations & ESG Disclosure Standards
- Global Copper Market Outlook
- Market Size & Forecast by Value
- Market Size & Forecast by Volume (Million Tonnes / Kilotonnes)
- Market Size & Forecast by Product Type
- Copper Concentrate
- Refined Copper Cathode (Grade A & Equivalent)
- Copper Rod (Continuous Cast & Drawn)
- Copper Wire & Cable
- Copper Tubes & Pipes
- Copper Sheets, Plates & Strips
- Copper Foil (Electrodeposited & Rolled, Including Battery & Electronics Grade)
- Copper Alloys (Brass, Bronze, Cupronickel, Beryllium Copper)
- Copper Powder, Granules & Specialty Forms
- Market Size & Forecast by Production Process
- Pyrometallurgical Smelting & Electrorefining (Flash, Mitsubishi, ISASMELT, Outokumpu)
- Hydrometallurgical Solvent Extraction & Electrowinning (SX-EW, Heap & Dump Leaching)
- Bioleaching, Atmospheric & Pressure Leaching of Chalcopyrite & Complex Ores
- Secondary Smelting, Scrap Refining & Recycled Copper Production
- Market Size & Forecast by Grade / Purity
- Electrolytic Tough Pitch (ETP) Copper
- Oxygen-Free High Conductivity (OFHC) Copper
- Phosphorus Deoxidised & Fire-Refined Copper
- Standard Industrial Grades & Off-Specification Copper
- Copper Alloy Grades (Brass, Bronze & Specialty Alloys)
- Market Size & Forecast by Project Scale
- Mega-Scale Integrated Copper Mining & Smelting Complexes (Above 500 ktpa)
- Large-Scale Copper Mining & Processing Projects (200 to 500 ktpa)
- Mid-Scale Mining & Custom Smelter Projects (50 to 200 ktpa)
- Small-Scale, Artisanal & Brownfield Recycling Projects (Below 50 ktpa)
- Market Size & Forecast by Application
- Electrical Wiring, Cabling & Power Transmission
- Building & Construction (Plumbing, Roofing, Architectural)
- Industrial Machinery, Equipment & Heat Exchangers
- Transportation, Automotive & Electric Vehicles (EV Drivetrain, Battery & Charging)
- Renewable Energy, Grid Infrastructure & Energy Storage
- Electronics, Semiconductors, Printed Circuit Boards & Battery Foils
- Telecommunications & Data Centre Infrastructure
- Consumer Durables, Appliances & Coinage
- Industrial Chemicals, Catalysts & Specialty Applications
- Market Size & Forecast by End-User Industry
- Power, Utilities & Renewable Energy Generators
- Automotive, EV & Battery Manufacturers
- Construction, Infrastructure & Real Estate Developers
- Electrical Equipment & Industrial Machinery Manufacturers
- Electronics, Semiconductor & Data Centre Operators
- Telecommunications & Network Equipment Providers
- Aerospace, Defence & Marine Industries
- Consumer Goods, Appliance & Coinage Manufacturers
- Market Size & Forecast by Sales Channel
- Direct Long-Term Off-Take & Annual Benchmark Contract
- Spot Market, LME / COMEX / SHFE Exchange-Linked Pricing
- Merchant, Trader & Commodity Brokerage Channel
- Distributor, Service Centre & Fabricator Network Channel
- Scrap Yard, Recycler & Secondary Refiner Channel
- North America Copper Market Outlook
- Market Size & Forecast
- By Value
- By Volume (Million Tonnes / Kilotonnes)
- By Product Type
- By Production Process
- By Grade / Purity
- By Project Scale
- By Application
- By End-User Industry
- By Country
- By Sales Channel
- Market Size & Forecast
- Europe Copper Market Outlook
- Market Size & Forecast
- By Value
- By Volume (Million Tonnes / Kilotonnes)
- By Product Type
- By Production Process
- By Grade / Purity
- By Project Scale
- By Application
- By End-User Industry
- By Country
- By Sales Channel
- Market Size & Forecast
- Asia-Pacific Copper Market Outlook
- Market Size & Forecast
- By Value
- By Volume (Million Tonnes / Kilotonnes)
- By Product Type
- By Production Process
- By Grade / Purity
- By Project Scale
- By Application
- By End-User Industry
- By Country
- By Sales Channel
- Market Size & Forecast
- Latin America Copper Market Outlook
- Market Size & Forecast
- By Value
- By Volume (Million Tonnes / Kilotonnes)
- By Product Type
- By Production Process
- By Grade / Purity
- By Project Scale
- By Application
- By End-User Industry
- By Country
- By Sales Channel
- Market Size & Forecast
- Middle East & Africa Copper Market Outlook
- Market Size & Forecast
- By Value
- By Volume (Million Tonnes / Kilotonnes)
- By Product Type
- By Production Process
- By Grade / Purity
- By Project Scale
- By Application
- By End-User Industry
- By Country
- By Sales Channel
- Market Size & Forecast
- Country-Wise* Copper Market Outlook
- Market Size & Forecast
- By Value
- By Volume (Million Tonnes / Kilotonnes)
- By Product Type
- By Production Process
- By Grade / Purity
- By Project Scale
- By Application
- By End-User Industry
- By Country
- By Sales Channel
- Market Size & Forecast
- *Countries Analyzed in the Syllogist Global Research Portfolio: United States, Canada, Mexico, Germany, France, United Kingdom, Netherlands, Spain, Italy, Norway, Sweden, China, Japan, India, Australia, South Korea, Singapore, Brazil, Chile, Saudi Arabia, UAE, Egypt, South Africa, Israel
- Technology Landscape & Innovation Analysis
- Pyrometallurgical Smelting Technology Deep-Dive (Flash, Mitsubishi, ISASMELT, Outokumpu, Top Submerged Lance)
- Hydrometallurgical SX-EW, Heap Leaching & Pressure Leaching Technology
- Bioleaching, Chalcopyrite Leaching & Low-Grade Ore Processing Innovations
- Concentrate Cleaning, Arsenic Removal & Complex Impurity Management Technology
- Secondary Copper Smelting, E-Waste & End-of-Life Scrap Recovery Technology
- Decarbonised Smelting, Hydrogen-Based Reduction & Electric Furnace Technology
- Digital Mining, AI-Enabled Process Optimisation & Smart Smelter Operations
- Patent & IP Landscape in Copper Production Technologies
- Value Chain & Supply Chain Analysis
- Copper Mining & Concentrate Producer Landscape
- Custom Smelter, Refinery & Toll Processing Operator Landscape
- Rod Mill, Wire, Cable, Tube & Fabricated Product Manufacturer Landscape
- Scrap Collection, Urban Mining, Recycler & Secondary Smelter Channel
- Commodity Trader, Merchant & Exchange-Linked Off-Take Channel
- Logistics, Bulk Shipping & LME-Approved Warehousing Network
- Mining Equipment, Reagent, Energy & Sulphuric Acid Input Supplier Channel
- Pricing Analysis
- LME Cash Settlement, 3-Month Futures & Forward Curve Analysis
- Treatment Charge (TC) & Refining Charge (RC) Benchmark & Spot Analysis
- Regional Premium (CME Comex, Shanghai, Rotterdam, ESG / Low-Carbon) Analysis
- Cathode, Rod, Wire & Fabricated Product Pricing Spread Analysis
- Mine-Site Cash Cost (C1, C2, AISC) & Smelter Margin Analysis
- Copper Scrap, No.1 & No.2 Spread vs. Cathode Pricing Analysis
- Sustainability & Environmental Analysis
- Lifecycle Carbon Footprint of Primary vs. Secondary Copper Across Mining, Smelting & Fabrication
- Decarbonisation Pathways for Copper Smelting (Hydrogen, Electrification, Renewable Power Integration)
- Tailings Management, Water Stewardship & Biodiversity Impact in Copper Mining
- Circular Economy, Urban Mining, E-Waste Recovery & Closed-Loop Copper Contribution
- Copper Mark, Responsible Copper Initiative, ICMM Alignment & ESG Premium Eligibility
- Competitive Landscape
- Market Structure & Concentration
- Market Consolidation Level (Fragmented vs. Consolidated by Product Type & Geography)
- Top 10 Players Market Share
- HHI (Herfindahl-Hirschman Index) Concentration Analysis
- Competitive Intensity Map by Product Type, Production Process & Geography
- Player Classification
- Integrated Copper Mining & Smelting Majors
- Pure-Play Copper Mining Companies
- Custom Toll Smelter & Refinery Operators
- Secondary Smelter & Copper Recycling Specialists
- Rod, Wire, Tube & Fabricated Copper Product Manufacturers
- State-Owned & National Copper Corporations
- Commodity Traders, Merchants & Specialist Hedging Houses
- Copper Alloy & Specialty Product Manufacturers
- Competitive Analysis Frameworks
- Market Share Analysis by Product Type, Production Process & Region
- Company Profile
- Company Overview & Headquarters
- Copper Products & Production Portfolio
- Key Customer Relationships & Long-Term Off-Take Agreements
- Mining, Smelting & Refining Footprint & Production Capacity
- Revenue (Copper Segment) & Order Book
- Technology Differentiators & IP
- Key Strategic Partnerships, JVs & M&A Activity
- Recent Developments (Mine Expansions, Smelter Upgrades, Off-Take Deals)
- SWOT Analysis
- Strategic Focus Areas & Roadmap
- Competitive Positioning Map (Production Cost Position vs. Market Penetration)
- Key Company Profiles
- Market Structure & Concentration
- Technology Landscape & Innovation Analysis
- Strategic Output
- Market Opportunity Matrix: By Product Type, Production Process, Application, End-User & Geography
- White Space Opportunity Analysis
- Strategic Recommendations
- Resource Replenishment, Mine Project Pipeline & Technology Investment Strategy
- Smelting, Refining & Operational Excellence Strategy
- Geographic Expansion & Supply Diversification Strategy
- Customer & End-User Engagement Strategy (Electrification, EV, Grid & Renewables)
- Partnership, M&A & Ecosystem Strategy
- Decarbonisation, Circular Copper & ESG-Aligned Strategy
- Risk Mitigation & Future Roadmap
- Strategic Priority Matrix & Roadmap
- Near-term (2025-2028)
- Mid-term (2029-2032)
- Long-term (2033-2037)